A 70% Win Rate Can Lose Money. A 30% Win Rate Can Print. Win Rate Alone Never Tells You Which
Two traders can win the exact same percentage of their trades and end the year with opposite results, because win rate on its own never says how big the wins were next to the losses.
You'll get the one formula that actually decides your edge, Expectancy = (Win% × Avg Win in R) minus (Loss% × Avg Loss in R), plus a full reference grid across five win rates and four reward-to-risk ratios, so you can see exactly where a strategy crosses from losing to profitable.
You'll get the breakeven win rate formula for any reward-to-risk ratio, the number your actual win rate has to clear before a strategy is worth trading at all, and why a strategy can be right most of the time and still be a net loser.
You'll get the same math running live in your browser twice: a one-screen expectancy calculator on this page, and a full trade log on your download page that scores every trade you enter in R and tracks your actual expectancy as it builds.
This card won't tell you which setups to trade.
It isn't trying to.
What it does is show you whether the setups you already trade are worth trading at all, in one number.

Win rate on its own never says how big the wins were next to the losses. Expectancy is the number that does.Jason Parker, Founder of Trading Habits
Introducing The Expectancy & R-Multiple Card.
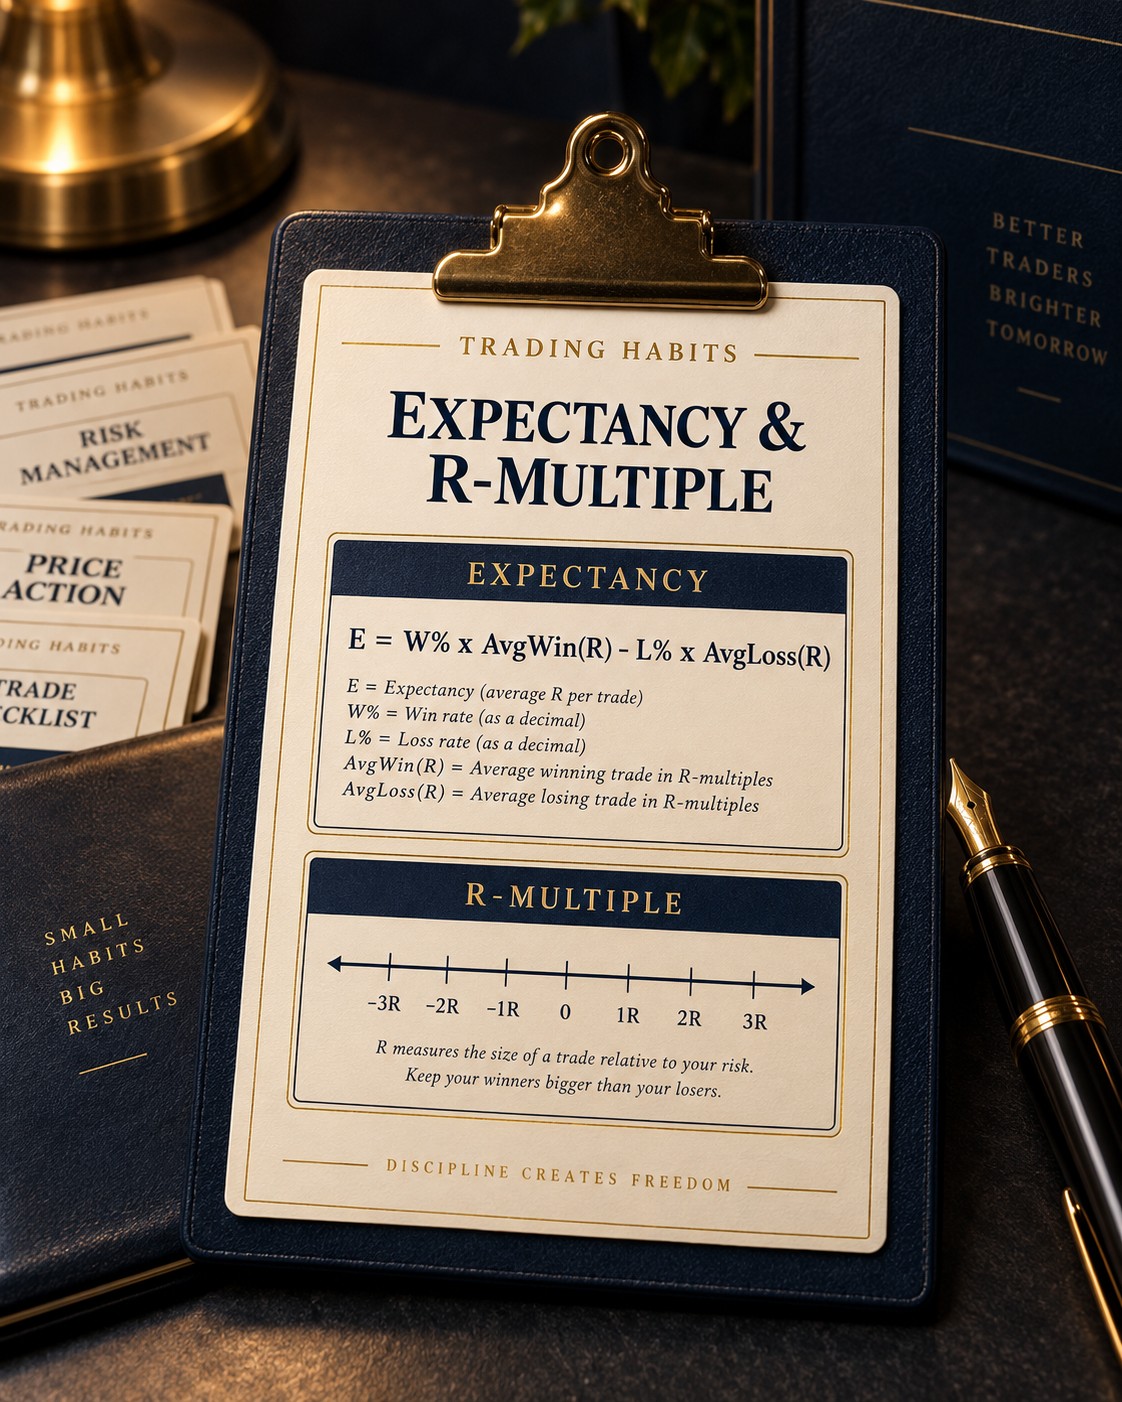
The Expectancy & R-Multiple Card
The one formula that decides whether a strategy is worth trading, and the breakeven win rate every reward-to-risk ratio has to clear.
- Format PDF, 7 pages, print or read on screen
- Covers R-multiples, the expectancy formula, a full win-rate-by-reward-ratio grid, and the breakeven win rate trap
- Includes A live calculator on this page and a fuller trade log and expectancy tracker on your download page
- Delivery Instant download right after checkout
Personal record-keeping and math only. Not a signal service and not a recommendation of any specific strategy, setup, or position size.
What's Inside
What's Inside The Expectancy & R-Multiple Card
- 01What an R-multiple is and how to score any closed trade in R: your result divided by what you actually risked, so a $600 win on a $300 risk is a 2R trade no matter what the dollar figures were.
- 02The expectancy formula: Expectancy = (Win% × Avg Win in R) minus (Loss% × Avg Loss in R), with a full worked example at a 40% win rate and a 2.5R average win.
- 03A complete reference grid: expectancy in R across five win rates (30% to 70%) and four reward-to-risk ratios (1:1 to 3:1), so you can find your own numbers and read the answer straight off the page.
- 04The breakeven win rate formula for any reward-to-risk ratio, and why a 2:1 setup only needs to win 33.3% of the time to have a positive edge, while a 1:1 setup needs to clear 50%.
- 05Two worked accounts side by side: a 40% win rate with a 2.5R average win that nets a positive edge, and a 70% win rate with a 0.3R average win that nets a negative one, despite winning far more often.
- 06The most common way traders fool themselves with win rate alone, and the three numbers to pull from a trading platform's own statistics instead.
- 07A blank worksheet for scoring your own last 20 closed trades in R and computing your actual expectancy by hand.
- 08Two live versions of the same math online: a snapshot calculator on this page, a fuller trade log and expectancy tracker that scores every trade you enter on your download page.
HABITS
★
Certificate of Guarantee
60-Day, No-Questions-Asked
If The Expectancy & R-Multiple Card doesn't earn a spot in your files, email us any time within 60 days of purchase for a full refund. No form to fill out. No reason required.
Instant Download
$6One-time payment. No subscription.
Order Now7-PAGE PDF · DELIVERED IMMEDIATELY AFTER CHECKOUT · 60-DAY GUARANTEE
Behind The Tool
Why Win Rate Alone Doesn't Tell The Story
The Same Win Rate, Two Different Outcomes
A trade's dollar result depends on the size behind it, which makes dollar figures useless for comparing one trade to another. An R-multiple fixes that: divide the result by what was actually risked on that trade, so a trade that risked $300 and made $750 is a 2.5R win regardless of account size, and a trade that risked $300 and lost $300 is a -1R loss. Once every trade is expressed in R, win rate and average win size can be combined into one number: Expectancy = (Win% × Avg Win in R) minus (Loss% × Avg Loss in R). A 40% win rate with a 2.5R average win nets +0.4R per trade. A 70% win rate with only a 0.3R average win nets -0.09R per trade, a loser, despite winning more than twice as often.
That's the entire reason expectancy, not win rate, is the number that decides whether a strategy is worth trading at all.
The Breakeven Win Rate Every Ratio Has To Clear
Every reward-to-risk ratio has its own minimum win rate, below which a strategy loses money even if every loser is capped at exactly 1R: Breakeven Win% = 1 ÷ (Reward-to-Risk Ratio + 1). A 1:1 ratio needs 50% just to break even. A 2:1 ratio only needs 33.3%. A 3:1 ratio needs just 25%. Trading a tight ratio close to 1:1 and expecting to win most of the time puts the bar much higher than most traders realize, while a wider ratio buys more room for a losing majority and still nets a positive edge.
The reference grid and breakeven table in this card are built to make that bar visible before a trader is deciding whether a setup is worth keeping, the same reasoning behind every other reference card in this line.
Try It: Calculate Your Own Expectancy
Expectancy / Trade
0.00R
Breakeven Win Rate
0%
Reward:Risk Ratio
0:1
Expected R / 100 Trades
0R
Enter your numbers above.
Expectancy (R) = (Win% × Avg Win) − (Loss% × Avg Loss), where Loss% = 100% − Win%. Breakeven Win% = Avg Loss ÷ (Avg Win + Avg Loss). The full trade log and expectancy tracker on your download page scores every trade you enter and tracks your actual expectancy as it builds, instead of the assumed numbers above.
Expectancy Reference Grid (In R Per Trade)
| Win Rate | 1:1 R:R | 1.5:1 R:R | 2:1 R:R | 3:1 R:R |
|---|---|---|---|---|
| 30% | −0.40R | −0.25R | −0.10R | +0.20R |
| 40% | −0.20R | 0.00R | +0.20R | +0.60R |
| 50% | 0.00R | +0.25R | +0.50R | +1.00R |
| 60% | +0.20R | +0.50R | +0.80R | +1.40R |
| 70% | +0.40R | +0.75R | +1.10R | +1.80R |
Assumes an average loss of 1R. Every cell is Expectancy = (Win% × Reward-to-Risk Ratio) − (Loss% × 1R). The full grid, plus the same table built out to a 4:1 ratio, is inside the card.
Mechanics only. Nothing on this page or in the card is a recommendation of any specific strategy, setup, entry, stop, or position size for your account.
Common Questions
What if my average loss isn't exactly 1R because my stop got slipped?
Enter your actual average loss in R rather than assuming 1R. The calculator and the card's formula both work with whatever average loss you provide, which is exactly why tracking your own R-multiples matters more than assuming every loss was capped at your intended stop.
Is expectancy the same thing as profit factor?
They're related but not identical. Profit factor is gross profit divided by gross loss across a set of trades, a single ratio. Expectancy is the average result, in R, you'd expect from one more trade at your current win rate and average win/loss size, which makes it easier to compare across strategies with different trade counts.
How many trades do I need before my expectancy number means anything?
The card covers this directly: a handful of trades can show a positive or negative expectancy purely by chance, and a small sample size is one of the most common ways traders draw the wrong conclusion from their own numbers. The trade log on your download page is built to accumulate results over many trades rather than a handful, for exactly this reason.