The Shop
Get the insights, the indicators, and the strategies all in one place.

No bundling math, no padding. What you preview for free is exactly what you get when you buy, backed by the same 60-day no-questions-asked guarantee as everything else in the shop.Jason Parker, Founder of Trading Habits
Setup Packs
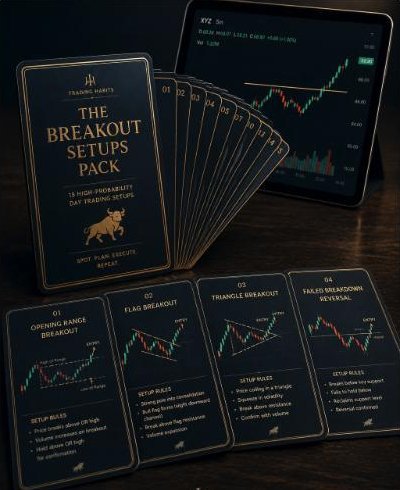
Every pack below is a set of specific, named setups: breakouts, pullbacks, reversals, ranges, and gaps. Click through every setup in a pack for free before you buy. Each one is priced individually at $1, so a 15-setup pack is $15 and a 17-setup pack is $17. No bundling math, no padding, what you preview is what you get. Same 60-day no-questions-asked guarantee as everything else in the shop.
Setup Pack · 15 Setups
Fifteen ways a level actually breaks, and the exact tell that separates a genuine breakout from a trap.
Click through every setup free before you buy
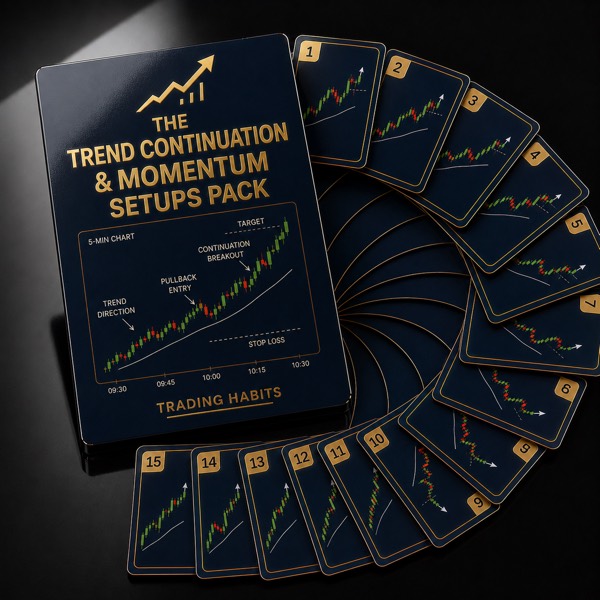
Setup Pack · 15 Setups
Fifteen ways to get back into a trend that's already working, without guessing how deep the pullback is supposed to be.
Click through every setup free before you buy
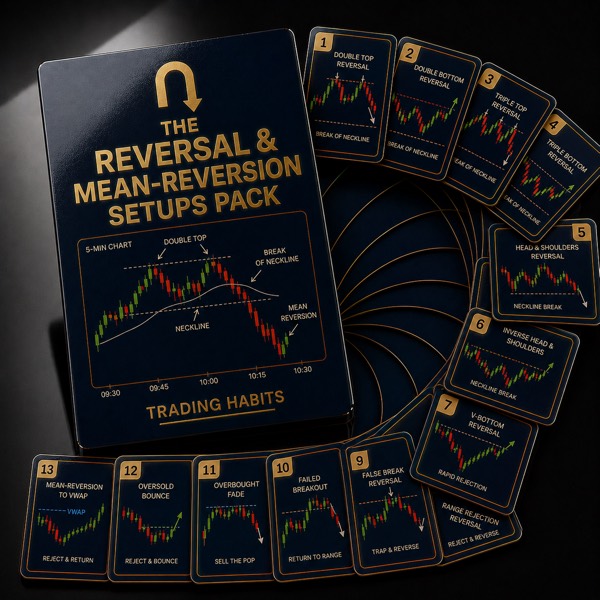
Setup Pack · 13 Setups
Thirteen ways to spot the exact moment an extended move runs out of the traders willing to chase it.
Click through every setup free before you buy
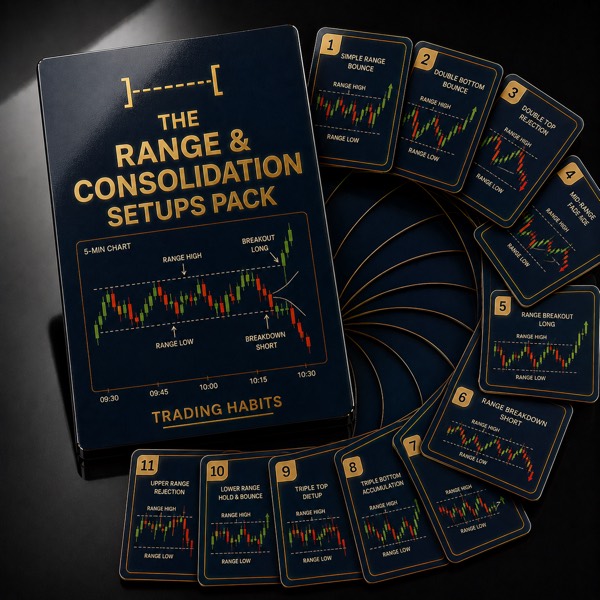
Setup Pack · 11 Setups
Eleven ways to trade a stock that's stuck between two levels instead of forcing a trend that isn't there.
Click through every setup free before you buy
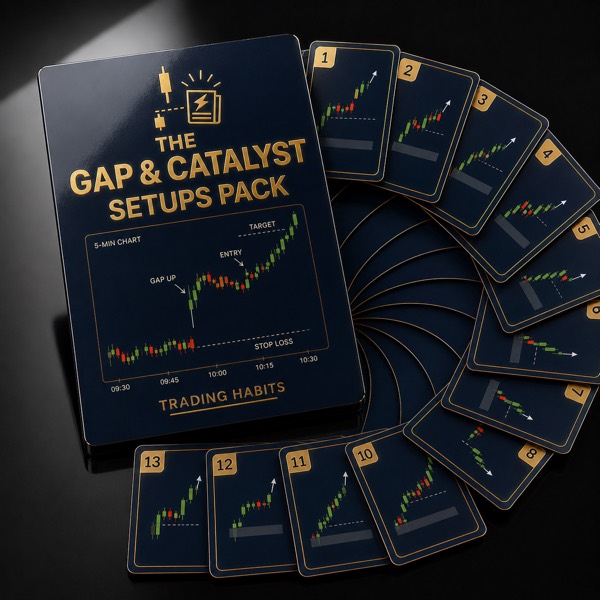
Setup Pack · 13 Setups
Thirteen setups for the first thirty minutes after news, earnings, or an overnight gap decide the day's direction.
Click through every setup free before you buy
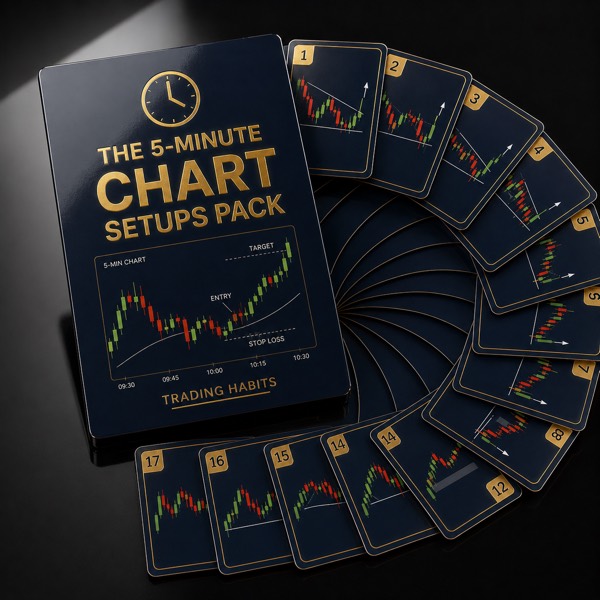
Setup Pack · 17 Setups
Seventeen setups defined the way they actually print on a five-minute candle, the timeframe most day traders already live on.
Click through every setup free before you buy
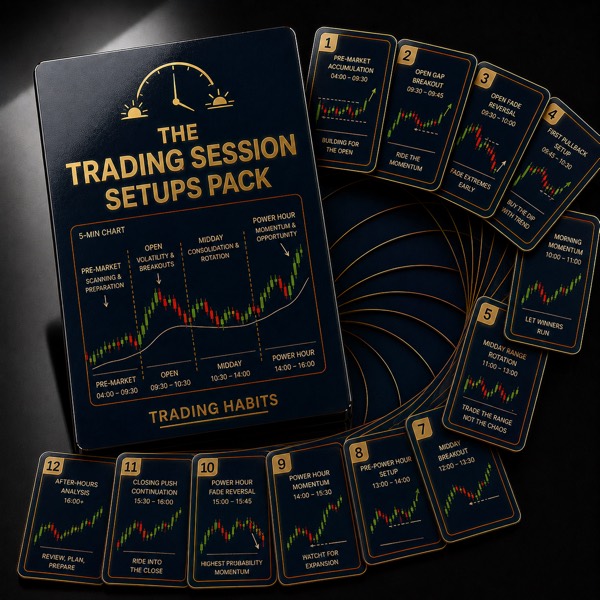
Setup Pack · 12 Setups
Twelve setups built around when they happen, from the pre-market gap to the closing bell, not only how they look on a chart.
Click through every setup free before you buy
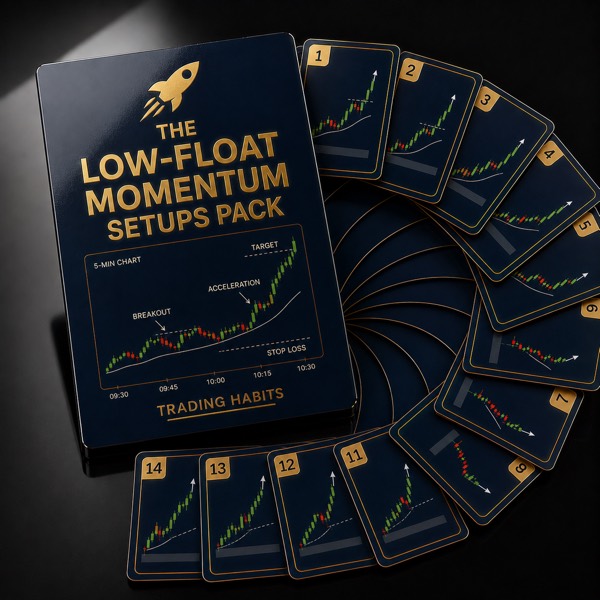
Setup Pack · 14 Setups
Fourteen setups built for thin, fast-moving stocks: halt resumptions, parabolic exhaustion shorts, and backside fades.
Click through every setup free before you buy
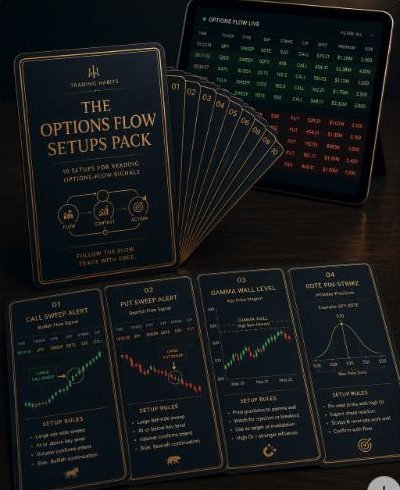
Setup Pack · 10 Setups
Ten setups for reading sweeps, gamma walls, and 0DTE pins, then trading the confirmation on the stock itself.
Click through every setup free before you buy
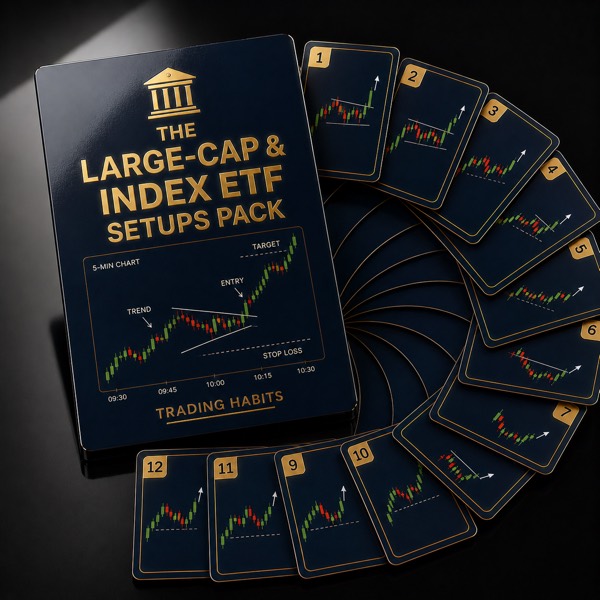
Setup Pack · 12 Setups
Twelve setups built for SPY, QQQ, and mega-caps, where deep liquidity changes which patterns actually hold up.
Click through every setup free before you buy
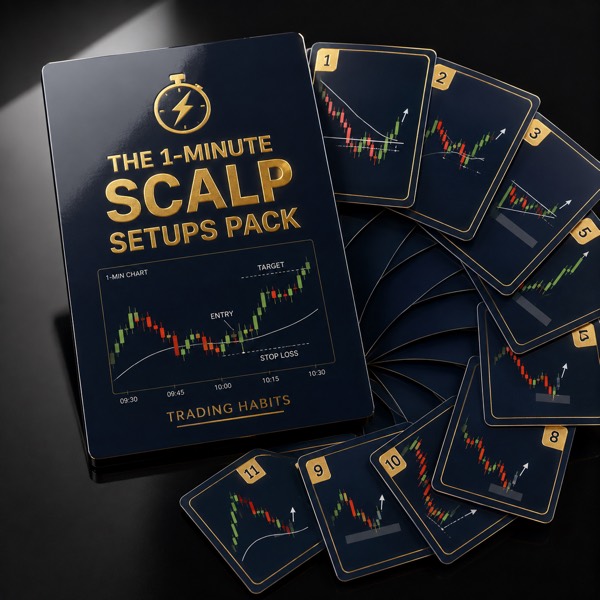
Setup Pack · 11 Setups
Eleven setups built for the fastest chart on the desk, where the tape underneath the candle decides the trade.
Click through every setup free before you buy
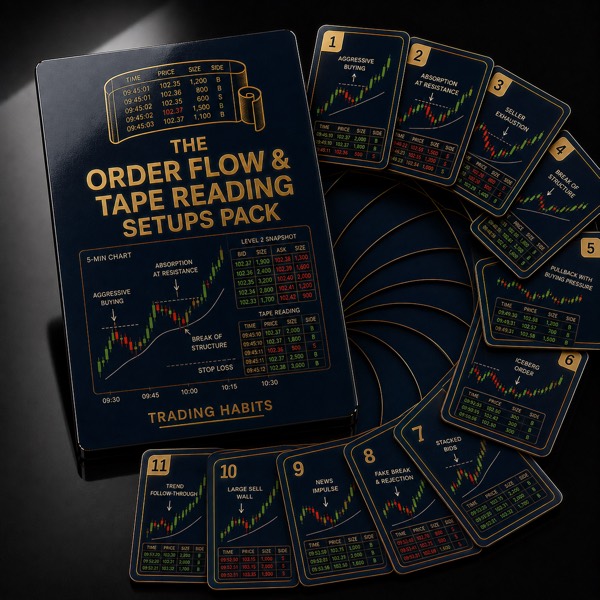
Setup Pack · 11 Setups
Eleven setups built around Level 2, time and sales, volume profile, and delta, the tape-reading layer underneath any chart pattern.
Click through every setup free before you buy
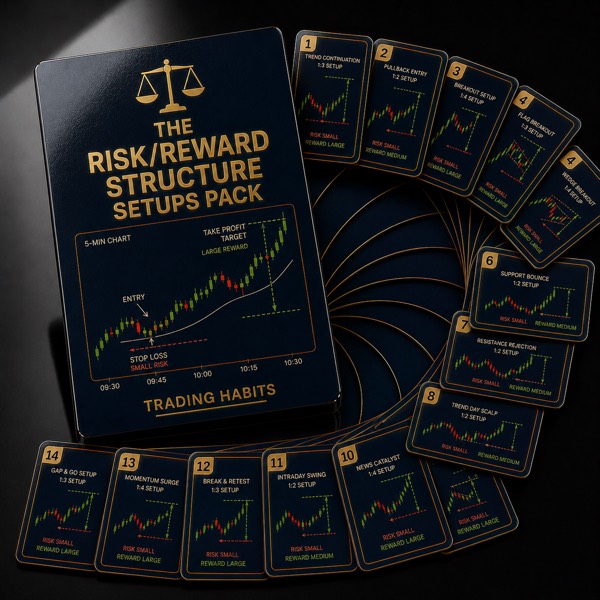
Setup Pack · 14 Setups
Fourteen setups split by risk/reward structure: 7 high-win-rate, low-R scalps and 7 low-win-rate, high-R momentum starters, side by side.
Click through every setup free before you buy
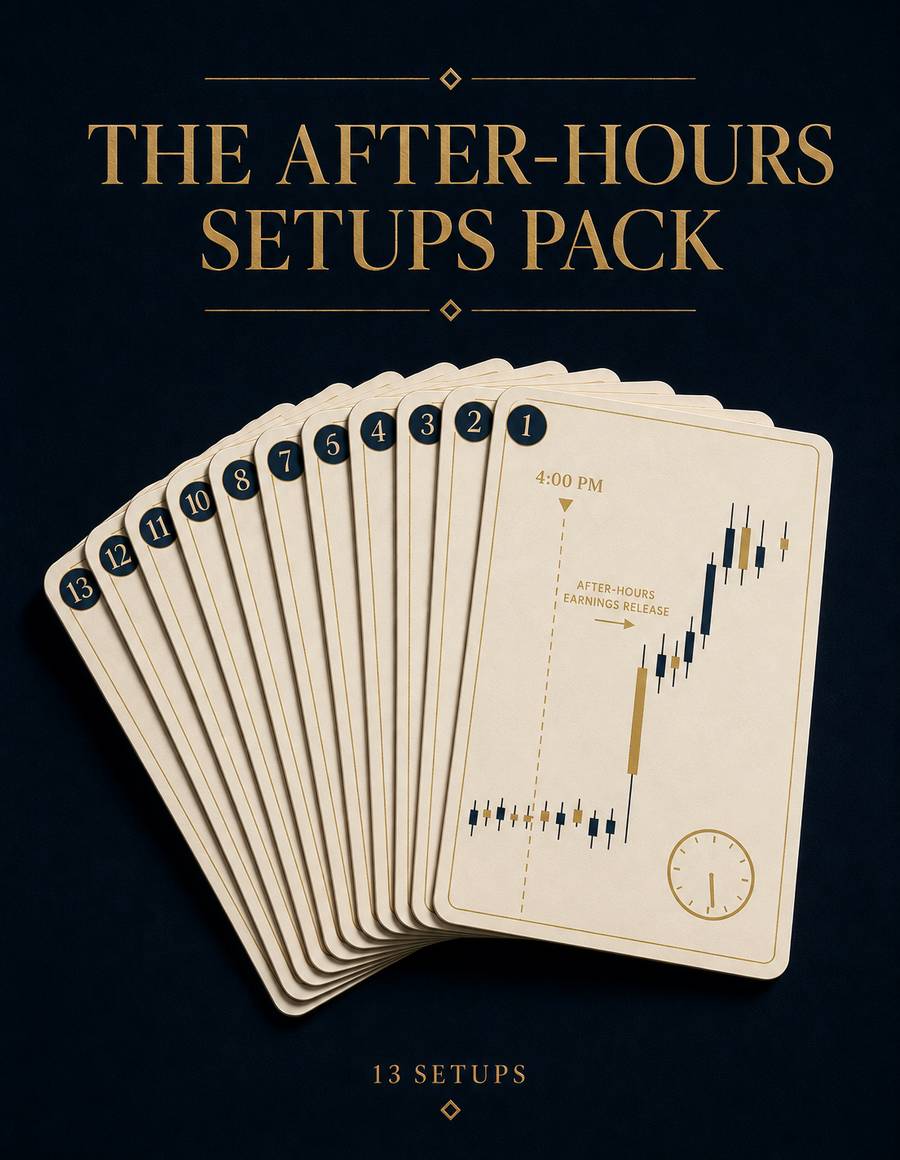
Setup Pack · 13 Setups
Thirteen ways to trade the thinner, news-driven tape after the closing bell, from earnings reactions to the after-hours VWAP.
Click through every setup free before you buy
Setup Pack · 13 Setups
Thirteen setups built for BTC/ETH volatility: funding-rate flips, weekend sessions, and Bitcoin Dominance rotation.
Click through every setup free before you buy
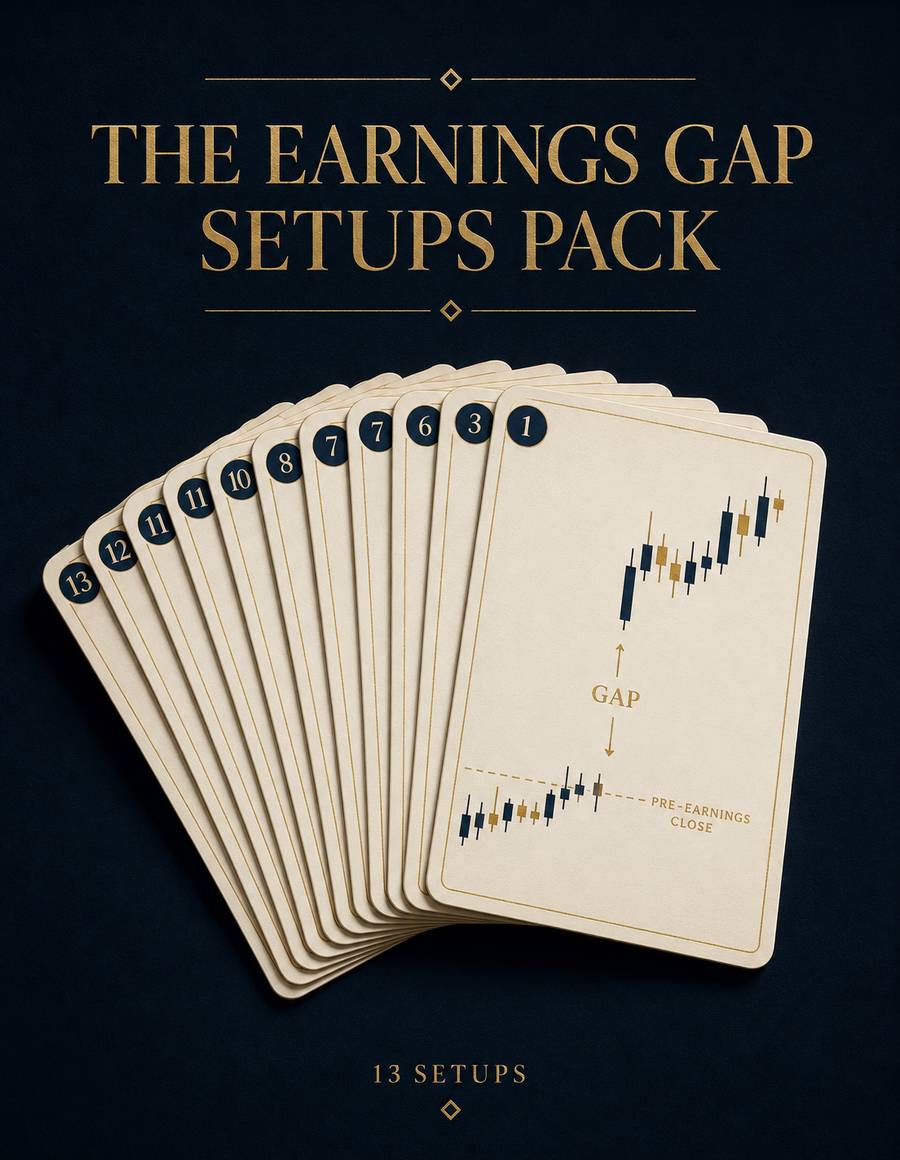
Setup Pack · 13 Setups
Thirteen ways to trade the earnings-gap pattern itself: gap-and-go, gap-fill fades, failed gaps, and multi-day drift.
Click through every setup free before you buy
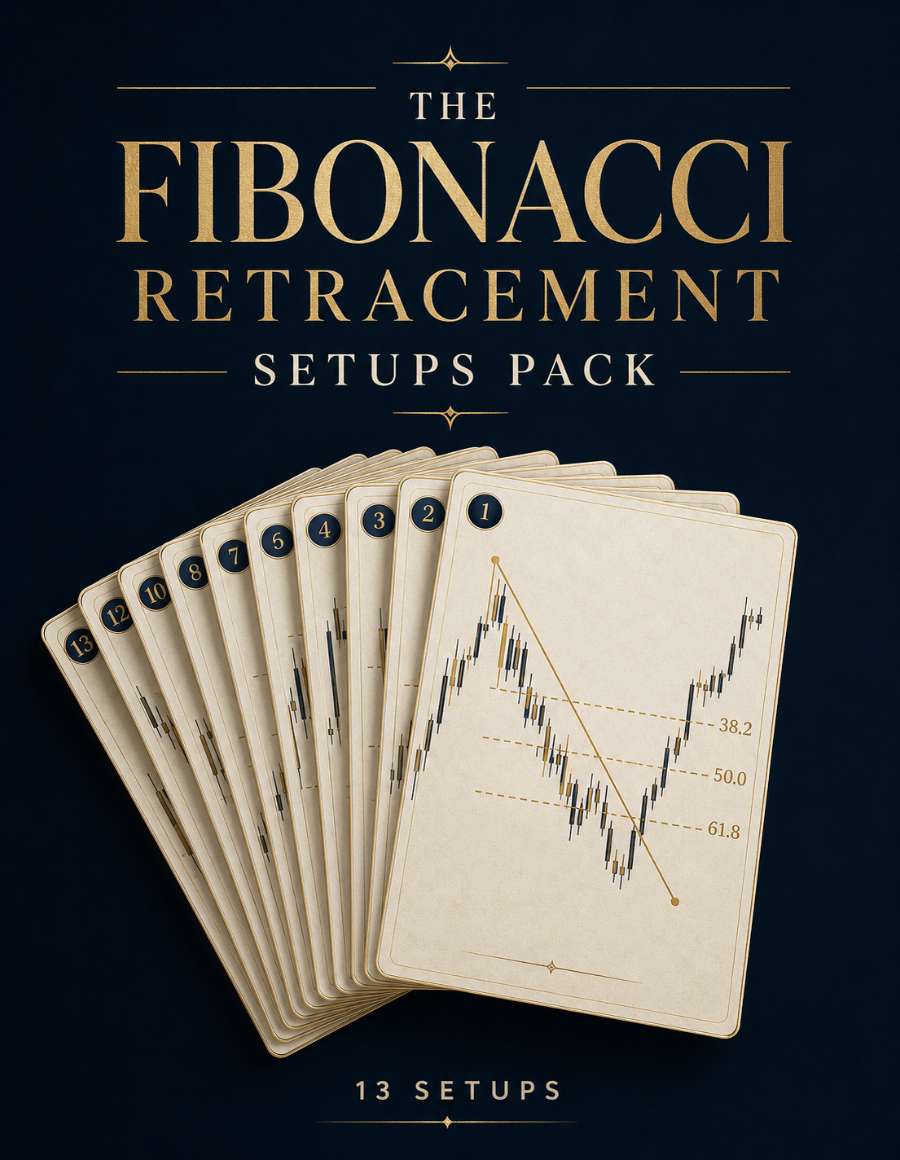
Setup Pack · 13 Setups
Thirteen setups built around confluence at the 38.2/50/61.8 retracement levels, including the golden pocket bounce.
Click through every setup free before you buy
Setup Pack · 13 Setups
Thirteen setups built around the Tokyo, London, and New York session opens and overlaps.
Click through every setup free before you buy
Setup Pack · 13 Setups
Thirteen setups isolating the head-and-shoulders pattern family: the classic top, its inverse bottom, retests, and failures.
Click through every setup free before you buy
Setup Pack · 13 Setups
Thirteen setups built around moving average bounces, crosses, and slope reads, from the fast EMA scalp to the 200-day reclaim.
Click through every setup free before you buy
Setup Pack · 13 Setups
Thirteen setups for trading the spread between two correlated instruments, long one leg and short the other.
Click through every setup free before you buy
Setup Pack · 13 Setups
Thirteen setups for reading pre-market volume, levels, and gap behavior before the opening bell ever rings.
Click through every setup free before you buy
Setup Pack · 13 Setups
Thirteen setups built around a stock's strength against its own sector or index, from leader pullbacks to RS divergences.
Click through every setup free before you buy
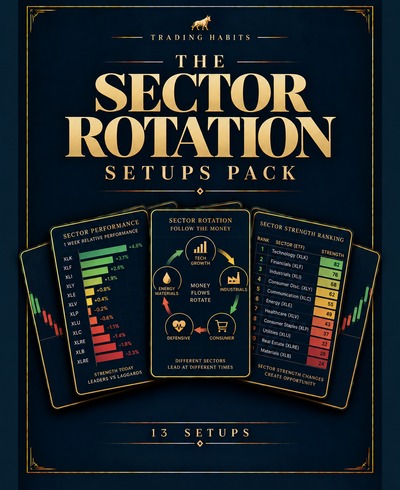
Setup Pack · 13 Setups
Thirteen setups for entering the sector money is rotating into, not the one it's leaving.
Click through every setup free before you buy
Setup Pack · 13 Setups
Thirteen setups built for the short side, with locate, borrow-fee, and squeeze-risk checks built into the entry.
Click through every setup free before you buy
Setup Pack · 13 Setups
Thirteen multi-day setups built for holding a position through more than one session.
Click through every setup free before you buy
Setup Pack · 13 Setups
Thirteen setups covering triangles and wedges as distinct pattern families, each with its own directional bias.
Click through every setup free before you buy
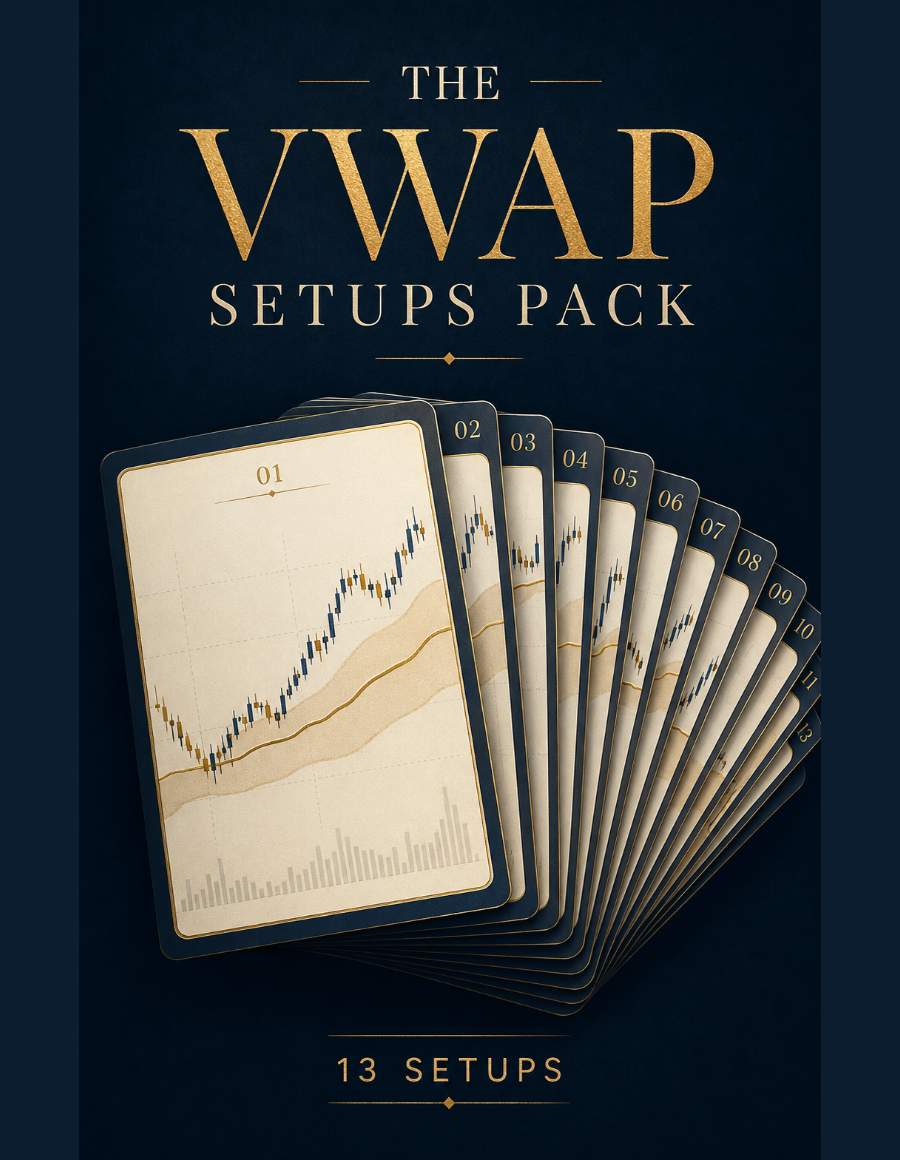
Setup Pack · 13 Setups
Thirteen VWAP-based setups across fade, ride, and band-walk entries on multiple instruments.
Click through every setup free before you buy
Setup Pack · 14 Setups
Fourteen candlestick reversal patterns, each with the confirmation candle that has to follow before it's a valid signal.
Click through every setup free before you buy
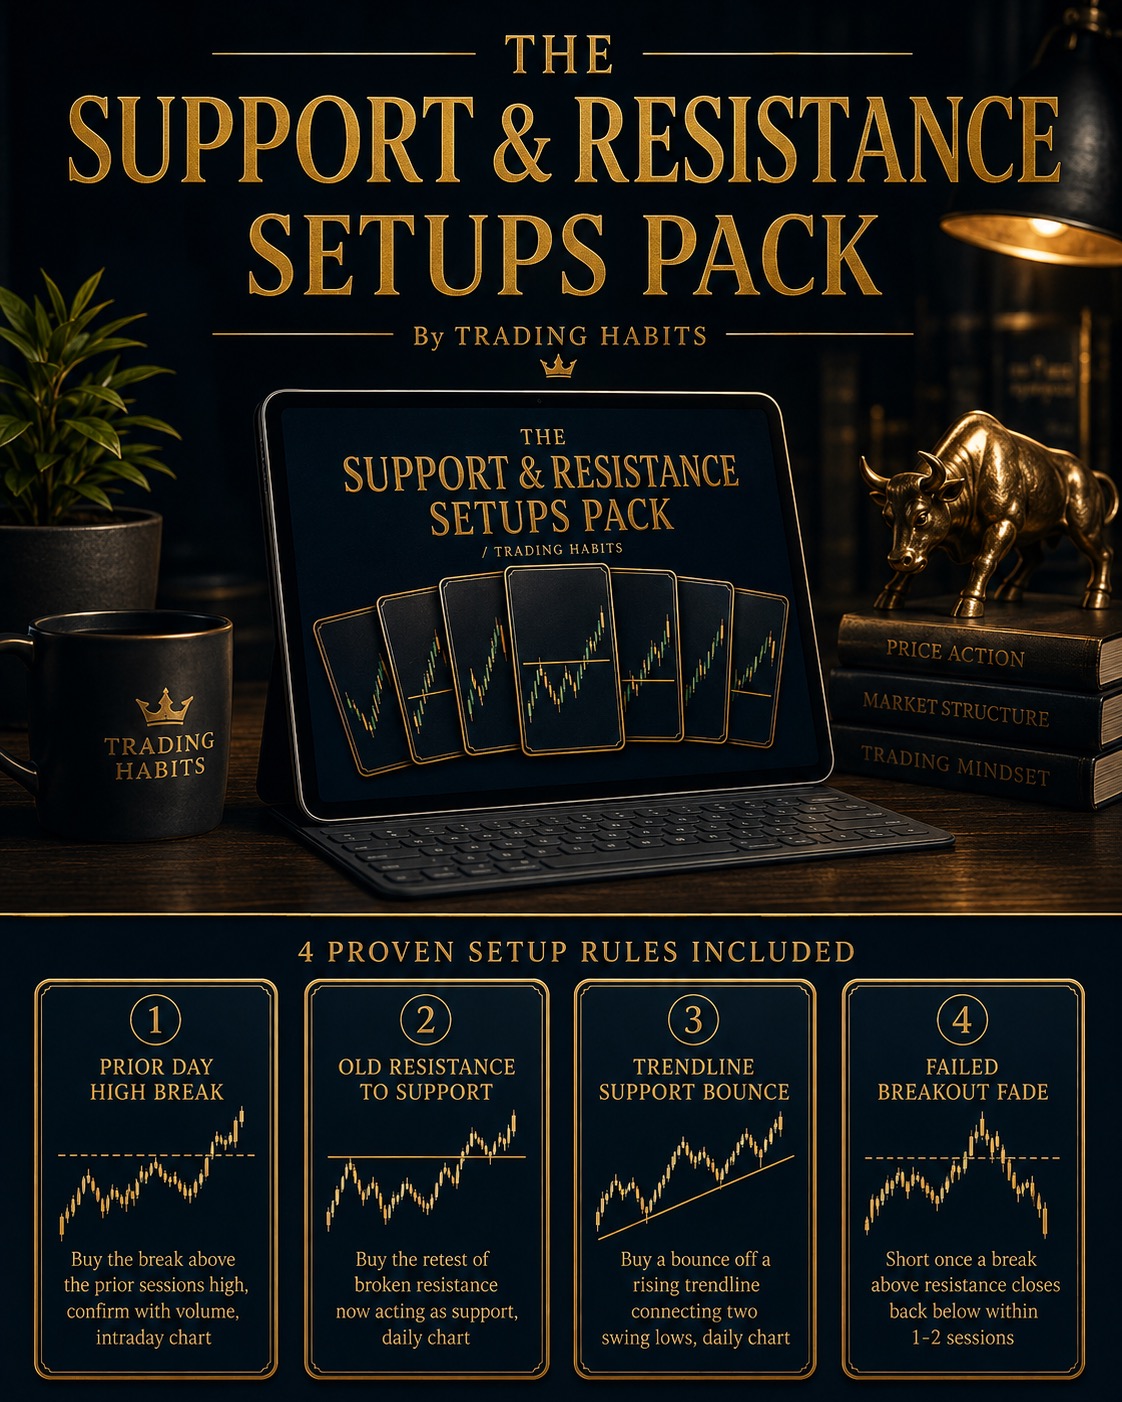
Setup Pack · 13 Setups
Thirteen setups for level bounces, breaks, prior-day highs and lows, round numbers, trendlines, and role-reversal retests.
Click through every setup free before you buy
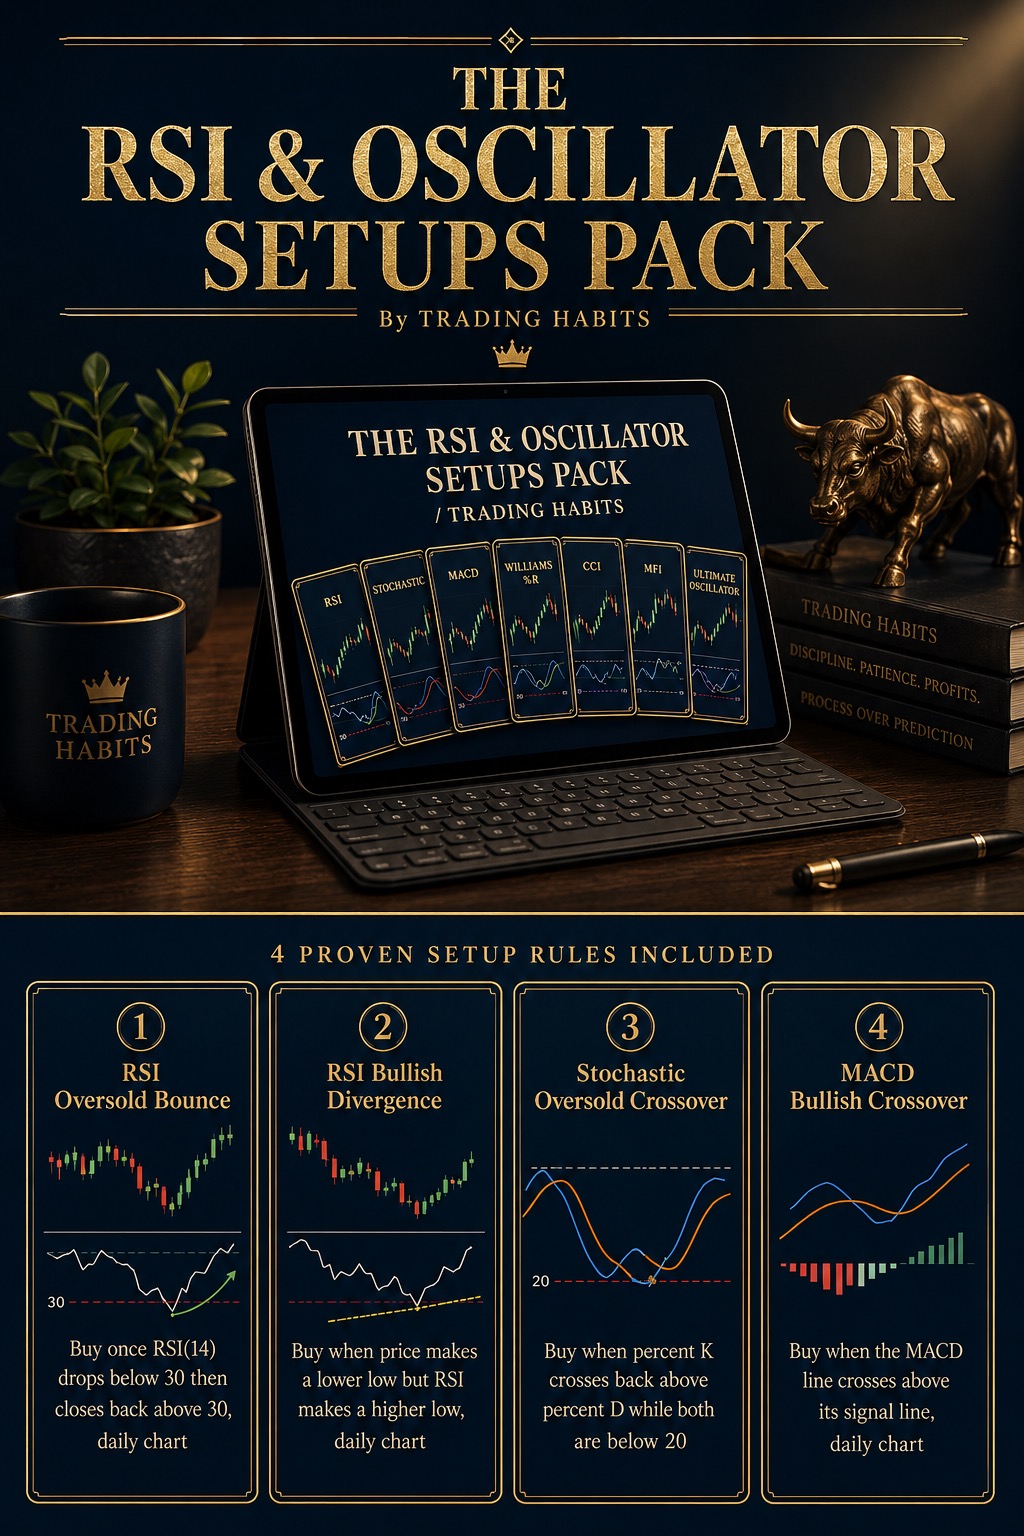
Setup Pack · 13 Setups
Thirteen setups across RSI, stochastic, and MACD, each used for what it actually measures instead of one interchangeable gauge.
Click through every setup free before you buy
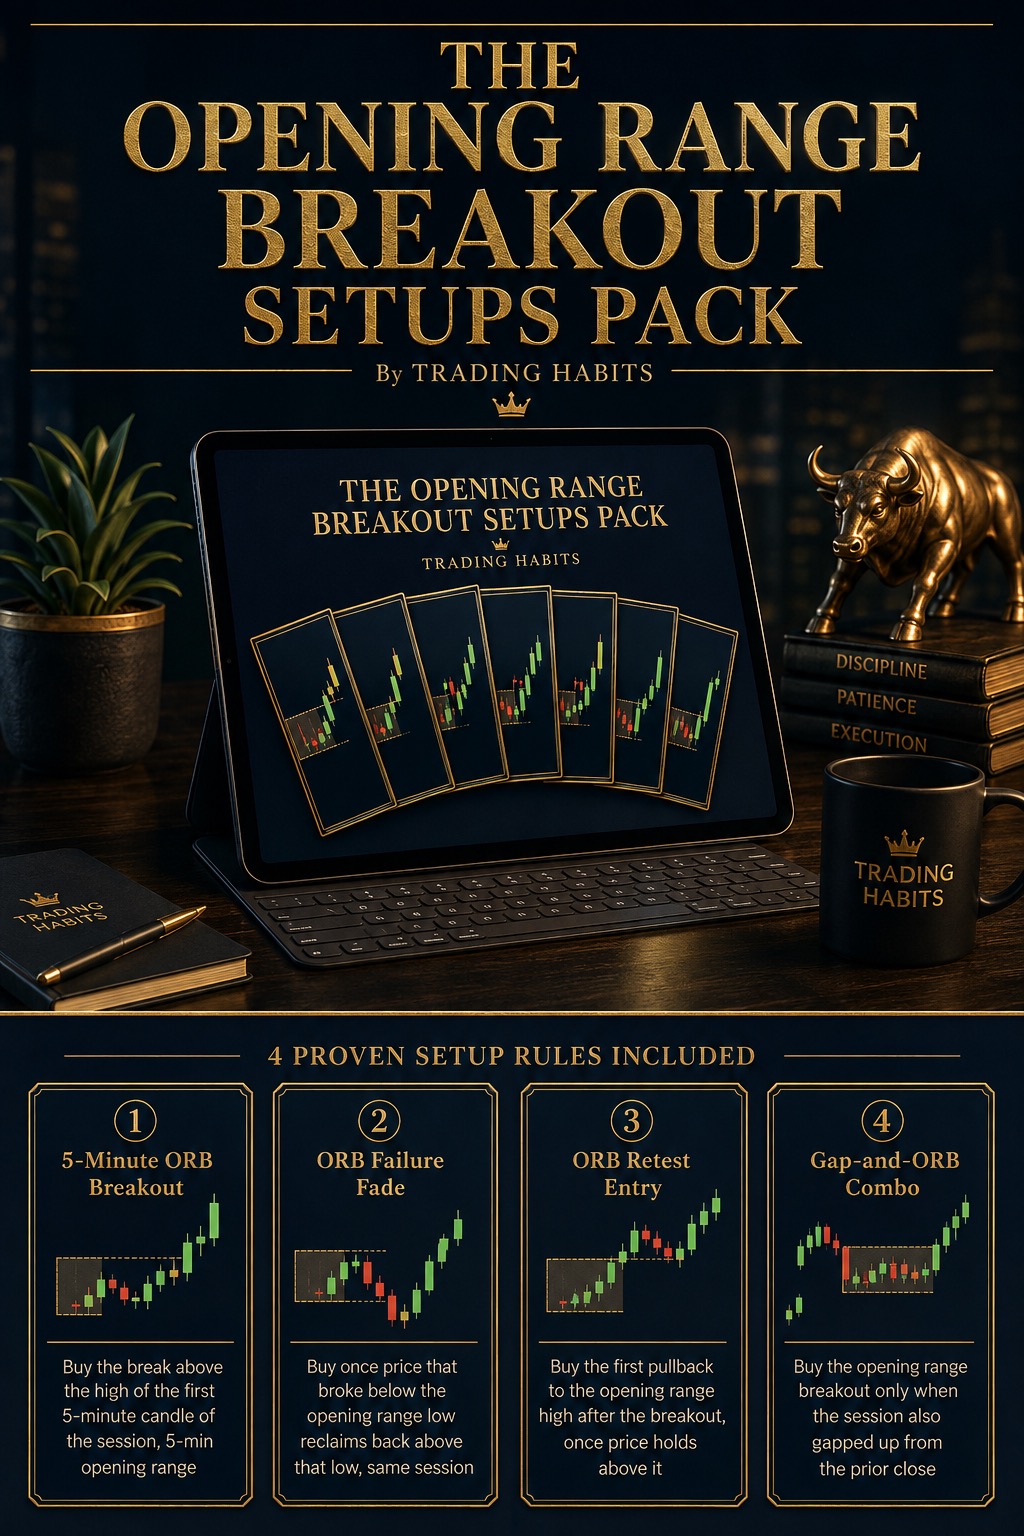
Setup Pack · 12 Setups
Twelve setups built specifically around the first 5 to 15 minutes of the session, breakouts, failure fades, retests, and confirmation filters.
Click through every setup free before you buy
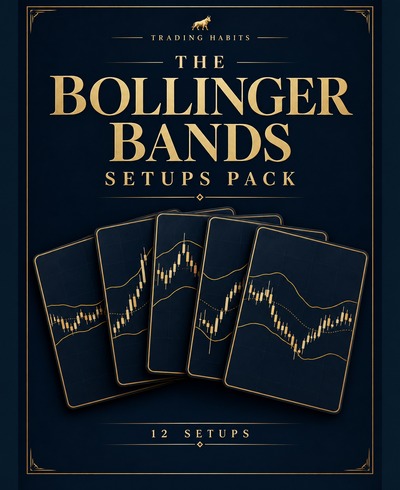
Setup Pack · 12 Setups
Twelve setups using all three Bollinger lines: band walks, the volatility squeeze, band fades, percent-B extremes, a pinch reversal, W-Bottom/M-Top band patterns, and midline reclaim/reject.
Click through every setup free before you buy
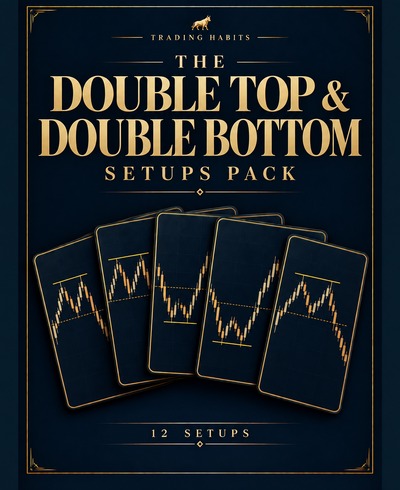
Setup Pack · 12 Setups
Twelve setups built around confirming an actual double top or double bottom: classic patterns at a major high or low, volume-divergence tells, neckline-break confirmation, failed-pattern trap fades, and mid-trend continuation context.
Click through every setup free before you buy
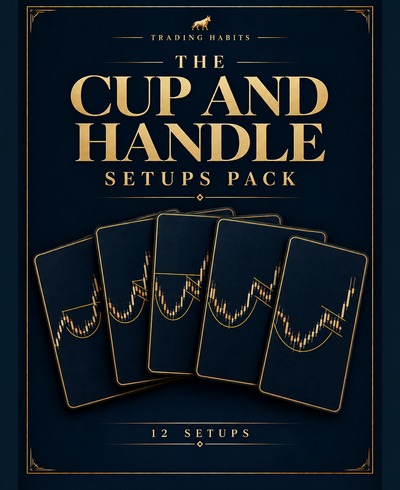
Setup Pack · 12 Setups
Twelve setups built around confirming an actual cup and handle, or its bearish inverted mirror, by what the handle actually does: classic pivot breakouts, pre-breakout handle entries, volume dry-up confirmation, tight-handle versions, mid-trend continuation context, and failed-pattern trap fades.
Click through every setup free before you buy
Setup Pack · 12 Setups
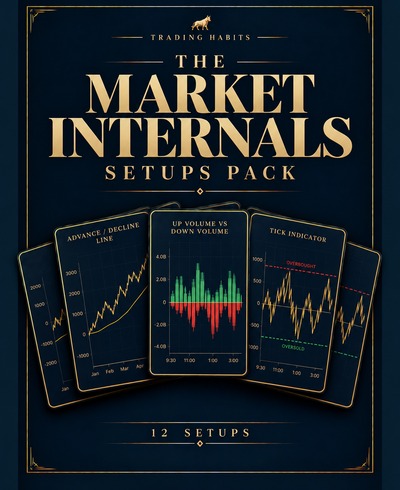
Twelve setups built around NYSE TICK, TRIN (the Arms Index), and the Advance/Decline line: TICK spike reversals and divergence, TRIN panic-climax reversals and trend confirmation, and Advance/Decline breadth-thrust and breadth-divergence setups.
Click through every setup free before you buy
Setup Pack · 12 Setups
Twelve setups built around the final trading hour: closing-range breakouts and breakdowns, market-on-close imbalance drift and fade read straight off the exchange's own data, last-hour VWAP reclaim and reject, a short-covering squeeze, and a failed-breakout trap.
Click through every setup free before you buy
Setup Pack · 12 Setups
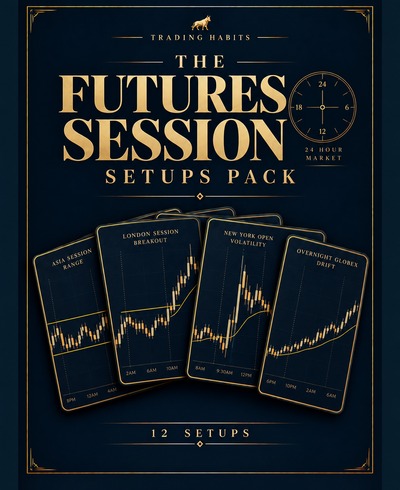
Twelve setups built around futures-only session mechanics: overnight Globex range breaks, Initial Balance breaks and a failed-breakout trap, prior-settlement reclaim and reject, Value Area High/Low, and Globex high/low liquidity sweeps.
Click through every setup free before you buy
Setup Pack · 12 Setups
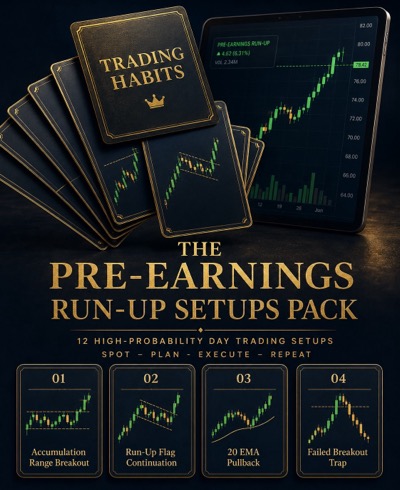
Twelve setups built around the positioning that shows up before a scheduled earnings date, not the gap after it: accumulation-range breaks, run-up flags, 20-EMA pullbacks, an exhaustion fade, a short-covering drift, a sector sympathy trade, a trendline hold, a failed-breakout trap, and a call-wall drift.
Click through every setup free before you buy
Setup Pack · 12 Setups
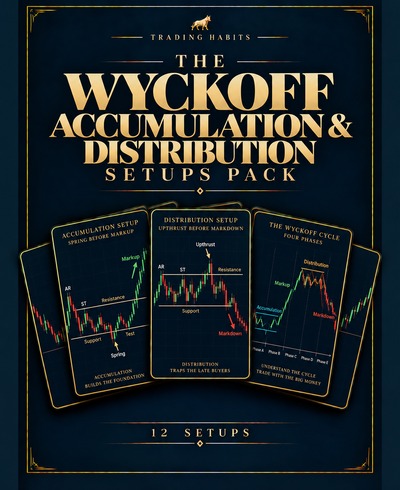
Twelve setups built around the classic Wyckoff trading-range schematic: spring and upthrust reversals, secondary tests, Sign of Strength and Sign of Weakness range breaks (including the single-bar creek-jump and ice-break versions), Last Point of Support and Last Point of Supply backups, and a markup trendline continuation.
Click through every setup free before you buy
Setup Pack · 12 Setups
Twelve setups built around a channel's own two parallel lines: ascending and descending pullbacks off the near boundary, breakout reversals through the far one, a horizontal parallel-channel breakout in both directions, failed-break traps at both boundaries (a bear trap and a bull trap), two channel-midline setups, and a measured-move breakout.
Click through every setup free before you buy
Setup Pack · 12 Setups
Twelve setups built around the one-bar illusion of a level that appears to break: a bull trap and a bear trap, a false breakout and false breakdown fade, a failed breakout retest and a failed breakdown retest, a failed range breakout and breakdown with both boundaries drawn, a failed opening range reversal through the opposite side, a liquidity sweep fade, a failed triangle breakout, and a generic trap-and-reverse setup.
Click through every setup free before you buy
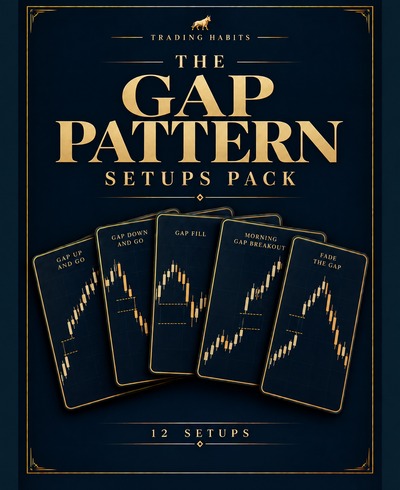
Setup Pack · 12 Setups
Twelve setups built around the classic technical-analysis gap taxonomy, no news or catalyst required: a breakaway gap and its mirror, a runaway/continuation gap and its mirror, an exhaustion gap reversal and its mirror, a common gap fade and its mirror, a partial gap fill continuation and its mirror, and an island top and island bottom reversal.
Click through every setup free before you buy
Setup Pack · 14 Setups
Fourteen setups built around the actual definition of a supply or demand zone, the tight base a stock traded through right before it left with force: fresh first tests, Drop-Base-Rally and Rally-Base-Drop formations, Rally-Base-Rally and Drop-Base-Drop continuation zones, second-test retests, multi-timeframe confluence, flip zones, and zone failures.
Click through every setup free before you buy
Setup Pack · 14 Setups
Fourteen setups covering the actual vocabulary of Smart Money Concepts and ICT trading: bullish/bearish order blocks, rejection blocks, fair value gaps, break of structure, change of character, and buy-side/sell-side/equal-highs/equal-lows liquidity sweeps.
Click through every setup free before you buy
Courses
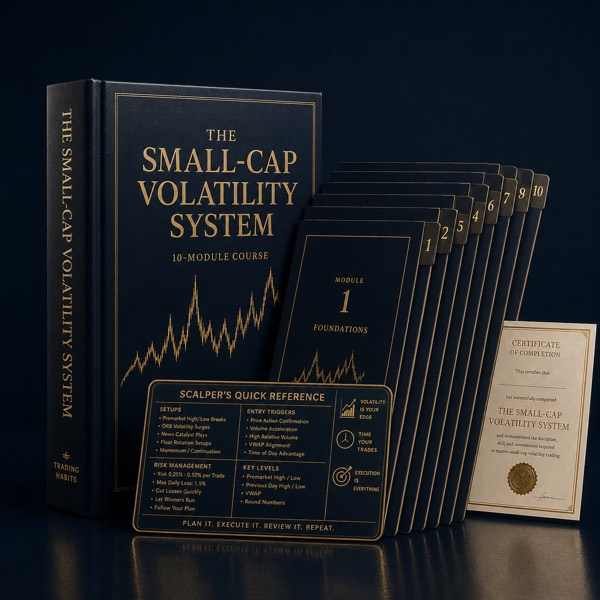
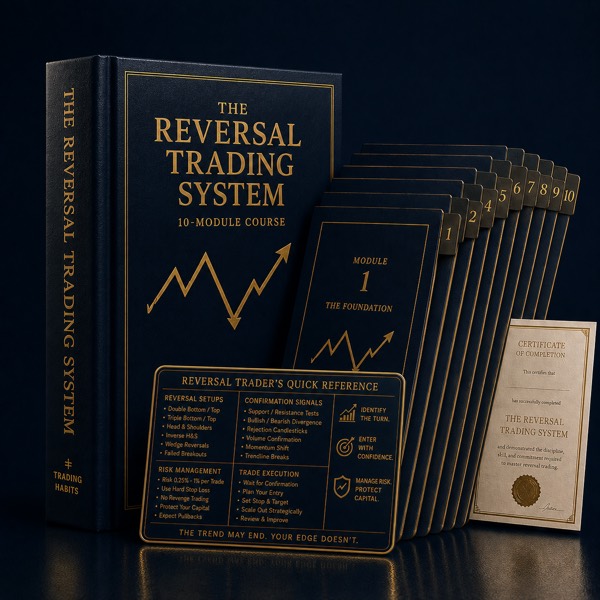
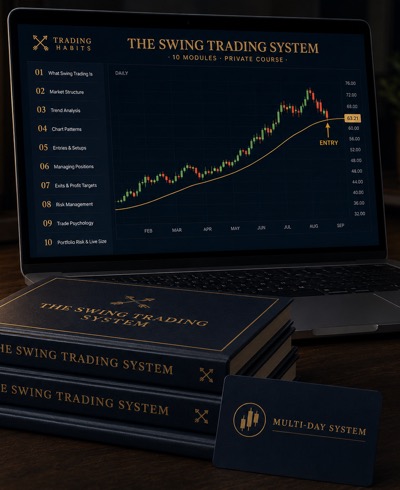
Full digital courses, from a 10-module deep dive on one trading style to a growing, interactive course built for someone starting at zero. Delivered as a private course page, not a PDF: instant access, no login, yours to re-read for good. Same 60-day no-questions-asked guarantee as everything else in the shop.
Trading Course · 10 Modules
The liquidity, spread, and order-flow math scalping runs on, five setups to backtest yourself, high-frequency risk sizing, and an 8-week path from simulator to live size.
Try the live spread-cost calculator on the page
Trading Course · 10 Modules
Float and dilution math, genuine catalysts versus promotion, halts and LULD bands, liquidity risk in thin names, the full risk of short selling, and a watchlist built to last past next week.
Try the limit up/limit down calculator with your own reference price
Trading Course · Interactive · Complete
Starts before the first chart, at what a stock actually is. Every term explained the moment it's used, interactive lessons, live calculators, two fillable planners, eleven scenario labs, a searchable flashcard glossary, a print/PDF version, and knowledge checks. All 11 parts live now, 66 lessons, complete from zero through your first 90 days, with more depth added at no extra cost.
Fill in the one-page trading plan, right on the page
Trading Course · 12 Modules
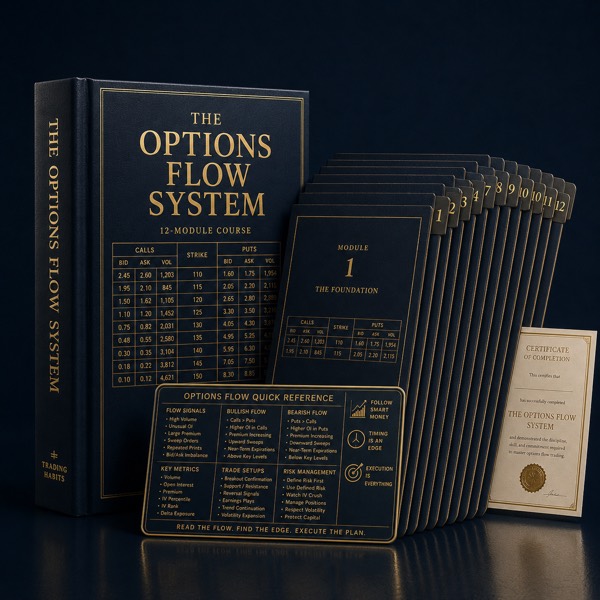
0DTE mechanics, the Greeks that actually matter, gamma squeeze mechanics, reading options flow, IV crush, spreads vs. naked risk, and the honest math behind turning $500 into $5,000.
Walk the options-market timeline from CBOE 1973 to today
Trading Course · 10 Modules
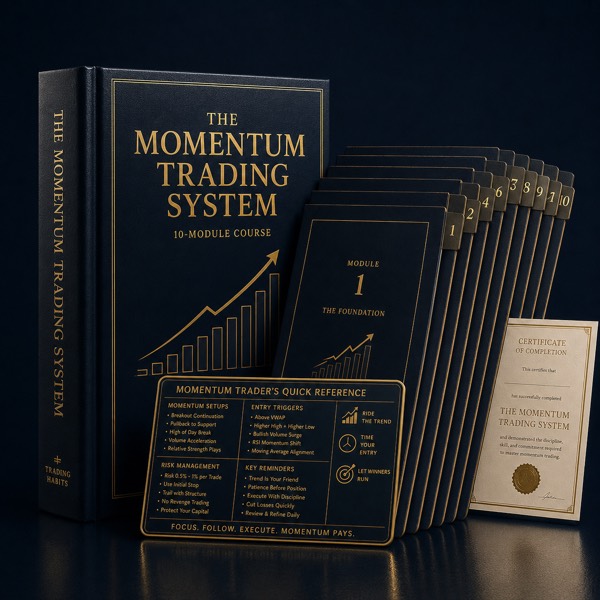
Relative volume, premarket gappers, new highs, momentum scanners, VWAP breaks, and opening range breakouts, with a working scanner builder and calculators built into the lessons.
Step through the three momentum-shift milestones on the page
Trading Course · 10 Modules
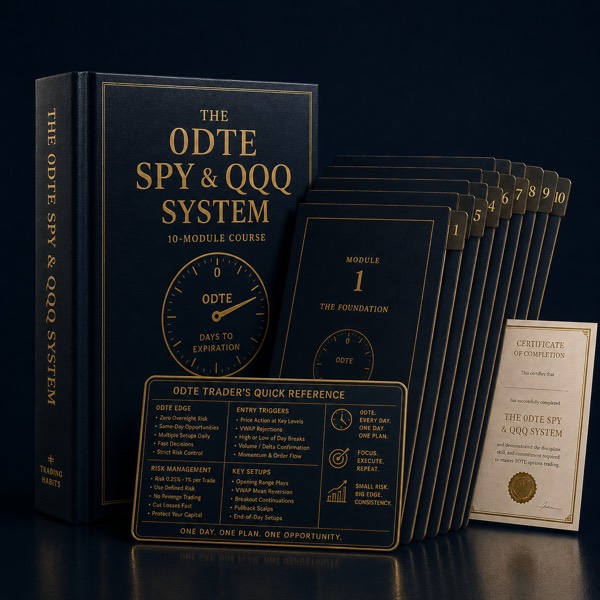
SPY at 9:30, calls vs. puts, the decay curve, the honest expected-value math behind the lottery trade, VWAP bias, key levels, CPI/FOMC/jobs-day behavior, and reading a huge intraday reversal.
Try the 0DTE expected-value calculator from Module 4
Scored Tool · Trading Habits Tool
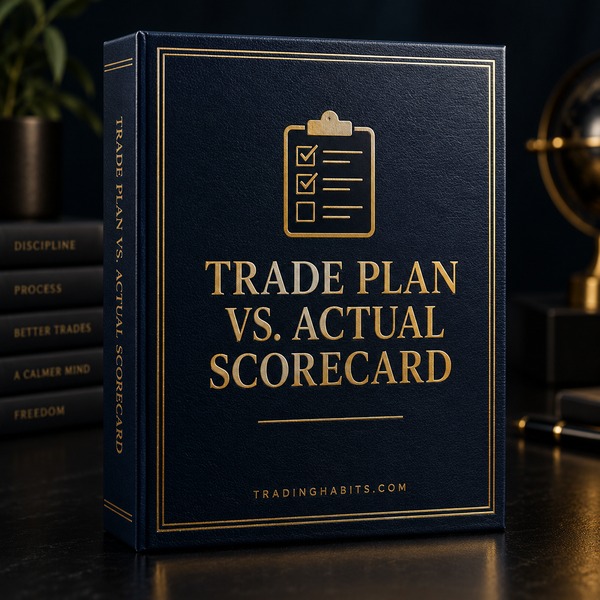
Log your pre-session plan, log what you actually did, and get a scored adherence breakdown across trade count, risk per trade, and setup fidelity, with session history saved in your browser.
The mechanical companion to the Psychology Audit Kit
Scored Audit · Trading Habits Tool
A 12-question scored audit across the same six behaviors as The Trading Psychology System, with a focused 2-week reset protocol for whichever one costs you most, plus a printable PDF field guide.
The fast entry point into The Trading Psychology System
Commitment Tool · Trading Habits Tool
Define specific, checkable trading rules and a genuine stake for breaking each one (a dollar pledge, a time-cost penalty, or a binding forfeit you set), then generate a printable contract to sign and a running log for every violation and every stake paid.
The commitment device the Audit Kit and Scorecard don't include
Trading Course · 10 Modules
Revenge trading, overtrading, FOMO, cutting winners short, moving stops, and breaking your own rules, each priced out with a working calculator, plus a tilt-score assessment and a 6-week behavioral reset.
Try the loss-aversion calculator on the page
Trading Course · 10 Modules
ES, MES, NQ, MNQ, crude oil, and gold: contract specs, margin and leverage, the nearly 24-hour session, position sizing in ticks, four setups to backtest, and an 8-week paper-to-live ramp.
Try the tick-value calculator from Module 2
Trading Course · 10 Modules
FTMO, Apex, and Topstep: max vs. daily vs. trailing drawdown, the consistency rule, the actual math behind passing a $50K challenge, funded-account scaling and payouts, and the behavioral patterns that pass a challenge and then blow up the funded account.
Try the trailing-drawdown calculator from Module 3
Trading Course · 10 Modules
The 9:30 to 10:30 window: the first 5-minute candle, the opening range, gap and go, gap fills, the opening drive, failed breakouts, VWAP, and the first pullback.
Try the opening-range calculator from Module 3
Trading Course · 10 Modules
Failed breakouts, bull traps, bear traps, HOD and LOD reversals, parabolic exhaustion, VWAP reclaim and fail, mean reversion at a stretched extreme, and the tighter risk math a countertrend trade actually needs.
Try the live trap depth calculator on the page
Trading Course · 12 Modules
IV crush, reading the gap, post-earnings drift versus reversal, four setups, straddle and spread strategy, and the binary-event sizing math a position with no overnight stop actually needs.
Try the expected-move calculator from Module 3
Trading Course · 10 Modules
CPI, FOMC, jobs report mornings, FDA decisions, analyst upgrades and downgrades, M&A, and breaking-news halts.
Run the surprise-vs-consensus math from Module 2
Trading Course · 10 Modules
Higher-timeframe context, five multi-day setups to backtest yourself, ATR-based stops and sizing for overnight risk, sector and relative-strength rotation, and the earnings-date discipline a multi-day hold actually needs.
Try the ATR-based position size calculator from Module 4
TradingView Indicators
Each indicator is a Pine Script v6 file coded for one specific method, one specific instrument, and one specific timeframe, tested live in TradingView's Pine Editor before it's listed here. Comes with a short cheat sheet PDF and exact install steps. Same 60-day no-questions-asked guarantee.
Every method below is decades old and still in daily use for a reason. Bollinger Bands, RSI, MACD, and the Chandelier Exit were built well before Pine Script existed, most of them worked out by hand on paper charts, and none of them have needed to change since. Each product page for these tools includes a short section on where its indicator actually came from.
TradingView Indicator · 7-Page Cheat Sheet
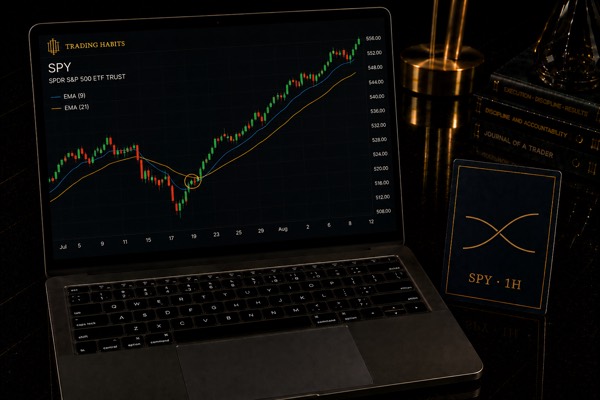
The standard 9/21 EMA crossover, coded for TradingView and tuned for SPY on 1-hour candles. Signal arrows, gap shading, and built-in alerts.
TradingView Indicator · 7-Page Cheat Sheet
John Bollinger's original 20-period, 2-standard-deviation default, coded for TradingView and tuned for BTC/USD on 4-hour candles, with reclaim-style signals.
TradingView Indicator · 7-Page Cheat Sheet
Session-anchored VWAP, coded for TradingView and tuned for AAPL on 5-minute candles, with Reclaim and Reject signal markers and built-in alerts.
TradingView Indicator · 7-Page Cheat Sheet
Wilder's classic 14-period RSI with 70/30 signals, coded for TradingView and tuned for TQQQ on 4-hour candles, with overbought/oversold cross markers and built-in alerts.
TradingView Indicator · 7-Page Cheat Sheet
Richard Donchian's classic price channel with the Turtle Traders' 20-bar convention, coded for TradingView and tuned for E-mini S&P 500 futures on 15-minute candles, with breakout markers and built-in alerts.
TradingView Indicator · 8-Page Cheat Sheet
Gerald Appel's classic 12/26/9 MACD, coded for TradingView and tuned for QQQ on daily candles, with crossover markers, histogram, and built-in alerts.
TradingView Indicator · 8-Page Cheat Sheet
George Lane's classic 14/3/3 Stochastic Oscillator with 80/20 signals, coded for TradingView and tuned for GLD on 1-hour candles, with cross markers and built-in alerts.
TradingView Indicator · 8-Page Cheat Sheet
Chuck LeBeau's classic 22-period, 3x ATR Chandelier Exit trailing stop, coded for TradingView and tuned for NQ1! E-mini Nasdaq-100 futures on 15-minute candles, with flip markers and built-in alerts.
TradingView Indicator · 8-Page Cheat Sheet
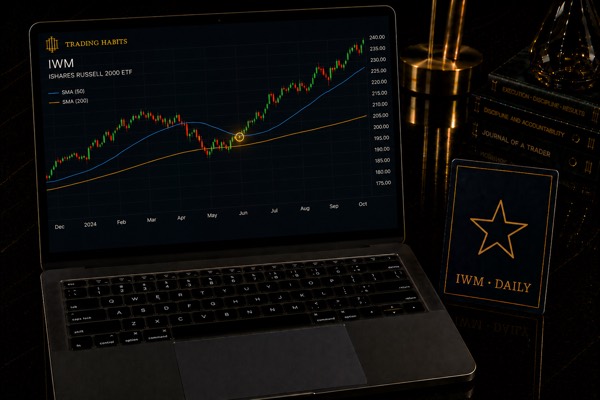
The classic 50-day / 200-day simple moving average crossover, coded for TradingView and tuned for IWM (iShares Russell 2000 ETF) on daily candles, with crossover markers and built-in alerts.
TradingView Indicator · 8-Page Cheat Sheet
Larry Williams' classic 14-period Williams %R with his own -20 / -80 overbought/oversold levels, coded for TradingView and tuned for AMD on 1-hour candles, with cross markers and built-in alerts.
TradingView Indicator · 8-Page Cheat Sheet
The classic 20-period EMA / 10-period ATR / 2.0x multiplier Keltner Channel, coded for TradingView and tuned for CL1! crude oil futures on 30-minute candles, with breakout markers and built-in alerts.
TradingView Indicator · 8-Page Cheat Sheet
Wilder's classic 14-period ADX/DMI trend-strength system with the standard 25-level threshold, coded for TradingView and tuned for MSFT on daily candles, with directional cross markers and built-in alerts.
TradingView Indicator · 8-Page Cheat Sheet
Wilder's classic Parabolic SAR trend-following stop system with the standard 0.02 starting/increment and 0.2 max acceleration factor, coded for TradingView and tuned for ETHUSD on the 4-hour chart, with flip markers and built-in alerts.
TradingView Indicator · 8-Page Cheat Sheet
Lambert's classic 20-period Commodity Channel Index with the standard ±100 overbought/oversold levels, coded for TradingView and tuned for SOXL on 1-hour candles, with re-entry markers and built-in alerts.
TradingView Indicator · 8-Page Cheat Sheet
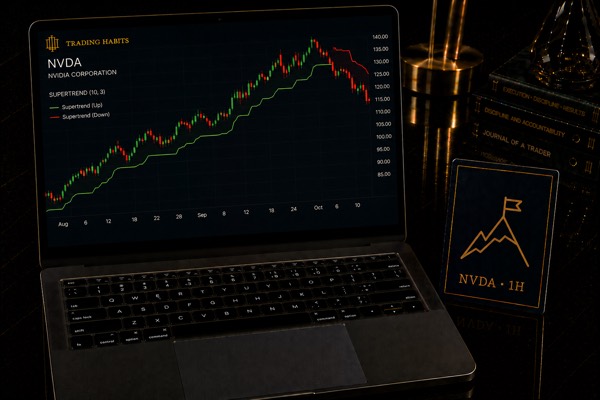
The ATR-based trailing trend line popularized by Olivier Seban, built on Wilder's original ATR, coded for TradingView and tuned for NVDA on 1-hour candles, with flip markers and built-in alerts.
TradingView Indicator · 8-Page Cheat Sheet
The volume-weighted 14-period Money Flow Index with the standard 80/20 overbought/oversold levels, coded for TradingView and tuned for SOLUSD on 30-minute candles, with re-entry markers and built-in alerts.
TradingView Indicator · 8-Page Cheat Sheet
Tushar Chande's original 25-period Aroon Up/Down, coded for TradingView and tuned for GC1! Gold futures on Daily candles, with cross markers and built-in alerts.
TradingView Indicator · 8-Page Cheat Sheet
Marc Chaikin's volume-and-price Money Flow reading with the standard 20-period lookback, coded for TradingView and tuned for XLE on 1-hour candles, with zero-line cross markers and built-in alerts.
TradingView Indicator · 7-Page Cheat Sheet
Joseph Granville's original On-Balance Volume line with a 20-period signal-line cross, coded for TradingView and tuned for COIN on daily candles, with cross markers and built-in alerts.
TradingView Indicator · 7-Page Cheat Sheet
The classic 12-period Price Rate of Change with a zero-line cross signal, coded for TradingView and tuned for TSLA on 15-minute candles, with cross markers and built-in alerts.
TradingView Indicator · 8-Page Cheat Sheet
Bill Williams' original 5/34 median-price Awesome Oscillator, coded for TradingView and tuned for PLTR on 1-hour candles, with zero-line cross markers and built-in alerts.
TradingView Indicator · 8-Page Cheat Sheet
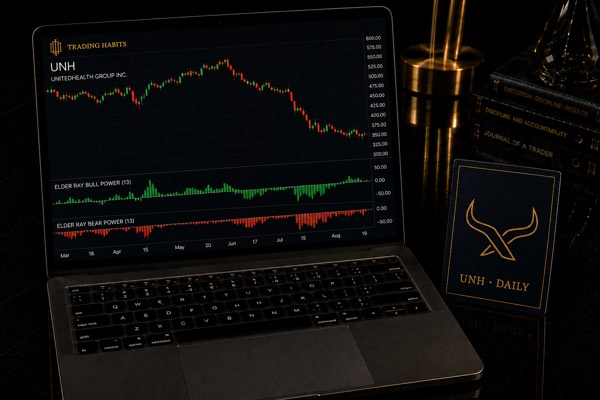
Dr. Alexander Elder's original 13-period Bull Power / Bear Power split, coded for TradingView and tuned for UNH on daily candles, with cross markers and built-in alerts.
TradingView Indicator · 8-Page Cheat Sheet
Botes and Siepman's original 14-period Vortex Indicator, coded for TradingView and tuned for XOM on 4-hour candles, with cross markers and built-in alerts.
Tools & Templates
Self-calculating workbooks and printable checklists for the parts of trading that are just record-keeping and arithmetic. No charts, no case studies, no theory. Same 60-day no-questions-asked guarantee.
None of the ideas behind these tools are new either. Risk-based position sizing traces to a 1956 paper written for Bell Labs, the wash sale rule is a piece of tax law from 1921, and the R-multiple comes from a 1998 book on trading psychology. Each product page below includes a short section on where its own method came from.
Trading Tool · XLSX Workbook
A self-calculating Excel trading journal. Log entry, exit, size, and stop, and get planned risk, realized P&L, R-multiple, weekly review, and a full stats dashboard automatically.
Try the expectancy calculator with your own win rate
Trading Tool · XLSX Workbook
Four inputs (account size, risk per trade, entry, stop) and a full risk-comparison table across eight risk percentages, calculated instantly. Works for stocks, ETFs, futures, or forex.
Try the live calculator before you buy the workbook
Trading Tool · 10-Page PDF
Seven printable checklists covering pre-market, entry, trade management, exit, and end-of-day, weekly, and monthly review, plus a blank template page to build your own.
Run the 5-item checklist live before you buy
Trading Tool · 6-Page PDF
One printable page for your own trading rules: markets, hours, setup criteria, risk limits, stop rule, exit rule, and what breaks the plan, plus an instructions page and a revision log.
Try writing one rule per line in the live worksheet
Trading Tool · XLSX Workbook
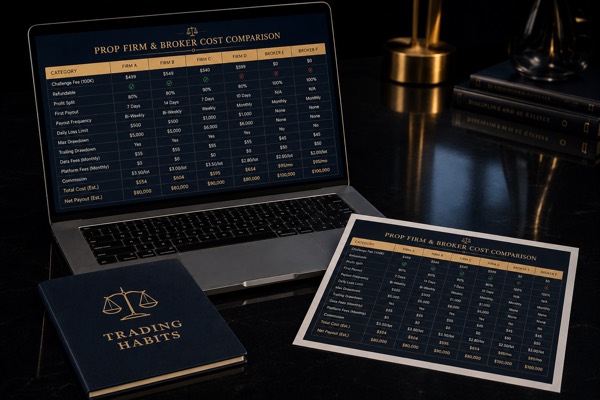
A blank comparison grid for lining up evaluation fees, splits, and drawdown rules across firms or brokers side by side, with fees and net payout calculated automatically from your own numbers.
See what a funded account actually nets you, live
Trading Tool · XLSX Workbook
Plan your size before a scheduled high-impact event, then log what you actually did. No built-in calendar, just a place to write the decision down and see how often you stuck to it.
Step through the news-event risk window on the page
Trading Tool · XLSX Workbook
A self-calculating record of proceeds, cost basis, gain/loss, and short-term vs. long-term holding period for every closed position, plus a summary tab, so tax season starts with your own numbers instead of a blank spreadsheet.
See the built-in wash-sale window checker on the page
Trading Tool · 6-Page PDF
A printable 30-day tracker for whether you followed your own trading rules, not whether the trade won, plus weekly reflection pages and a second blank month for next time.
Try the click-to-build streak grid on the page
Trading Tool · 6-Page PDF
Stock exchange hours for ten major markets, all four forex sessions in UTC, the three overlap windows, a futures note, and a blank worksheet for your own trading hours.
See the live clock showing which sessions are open now
Trading Tool · XLSX Workbook
2026 market holidays and early closes, the Fed's own tentative FOMC meeting schedule with a self-updating days-until countdown, and typical timing for recurring economic releases, all in one workbook.
Step through the FOMC's own meeting cadence on the page
Trading Tool · XLSX Workbook
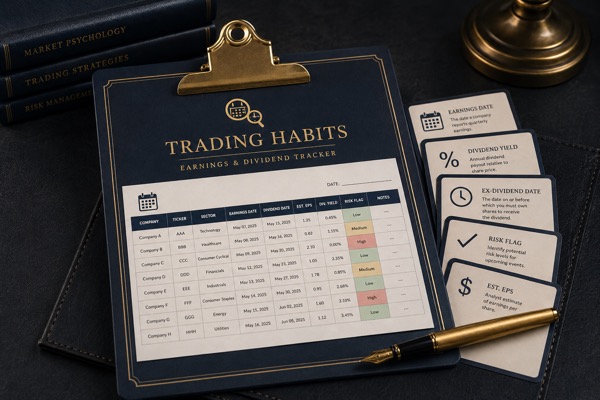
A self-calculating watchlist for earnings dates and dividend dates, with an automatic no-new-positions risk flag and an ex-dividend date that calculates itself from the record date you enter.
Try the days-until-earnings risk calculator on the page
Trading Tool · 6-Page PDF
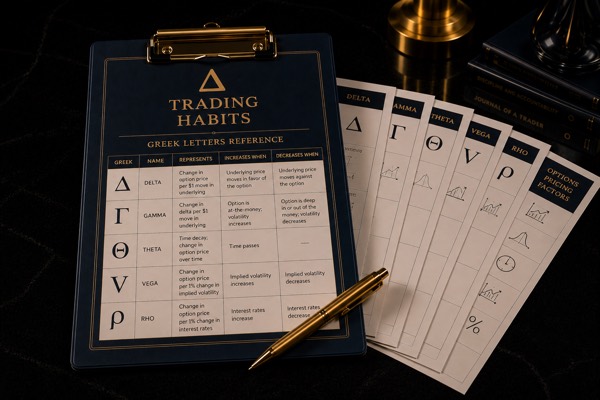
Plain-English definitions for Delta, Gamma, Theta, Vega, and Rho, a Greeks-at-a-glance comparison table, and a blank log for recording what your own broker's platform shows.
Slide the strike and watch Delta move in live
Trading Tool · 14-Page PDF
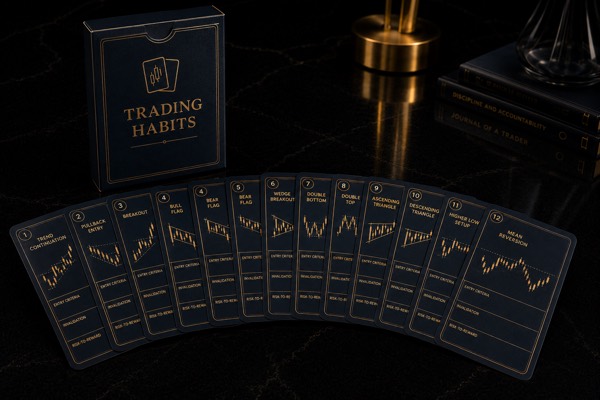
Twelve blank cards, one per setup archetype, each with the same five fields for your own entry criteria, invalidation, and risk-to-reward. You supply every answer.
Watch memory recall fade without a written card
Trading Tool · 6-Page PDF
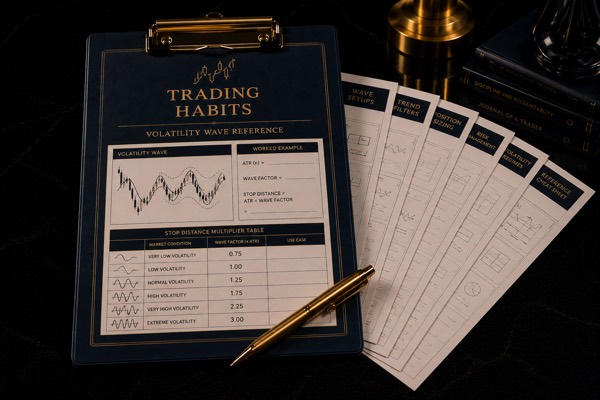
The ATR-based position sizing formula explained in plain English, a worked example, a stop-distance multiplier reference table, and a blank worksheet for your own numbers.
Try the live ATR stop-and-size calculator
Trading Tool · 6-Page PDF
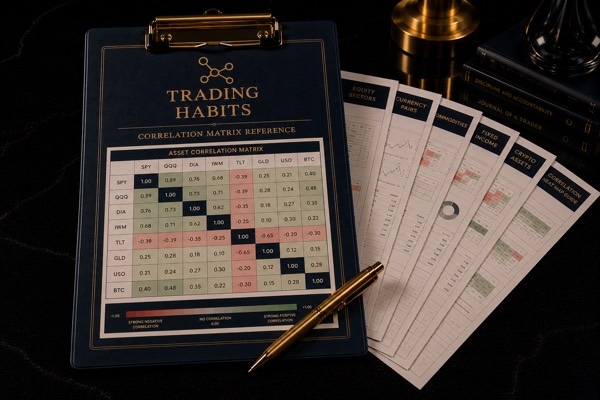
General, historically observed tendencies between common asset pairs, framed as a starting reference, plus a blank log for your own correlation notes.
Run Markowitz's own diversification math yourself
Trading Tool · 6-Page PDF
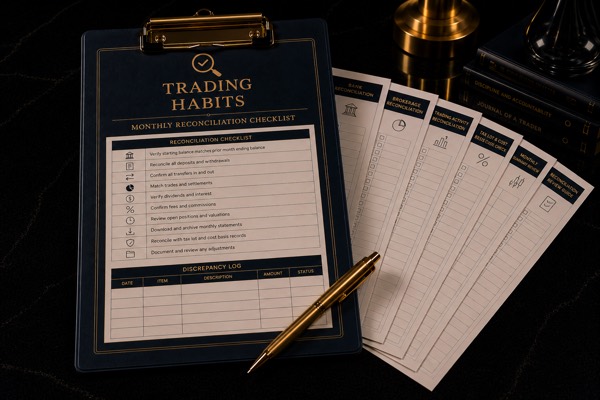
A monthly checklist for matching your own trade log against your broker's official statement, with a blank discrepancy log for anything that doesn't add up.
Reconcile four sample rows against a statement live
Trading Tool · 6-Page PDF
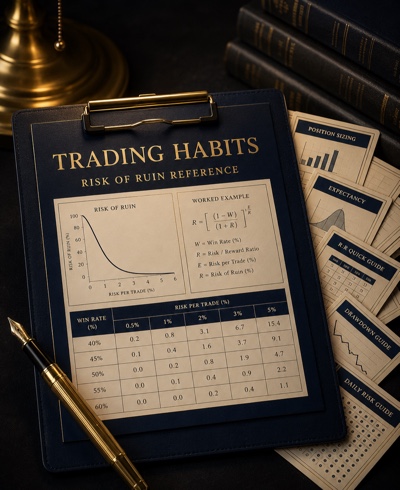
The formula tying win rate and position size to your odds of blowing up an account, one worked example, a reference table across common win rates and risk sizes, and a blank worksheet.
Run the live Risk of Ruin calculator yourself
Trading Tool · 7-Page PDF
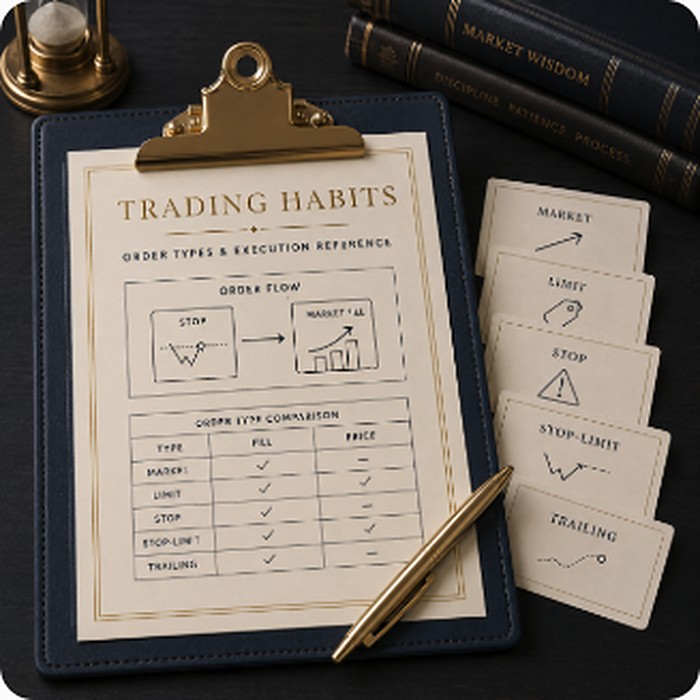
Market, limit, stop, stop-limit, and trailing-stop orders explained in plain English, a worked stop-market vs. stop-limit gap example, and a blank order-type decision worksheet.
See a stop-market and stop-limit fill the same gap differently
Trading Tool · XLSX Workbook
A self-calculating workbook for a prop firm evaluation: enter your own daily loss limit, static or trailing drawdown, profit target, and consistency cap once, then log one balance a day.
See your drawdown floor recalculate for static vs. trailing
Trading Tool · PDF + Live Calculator
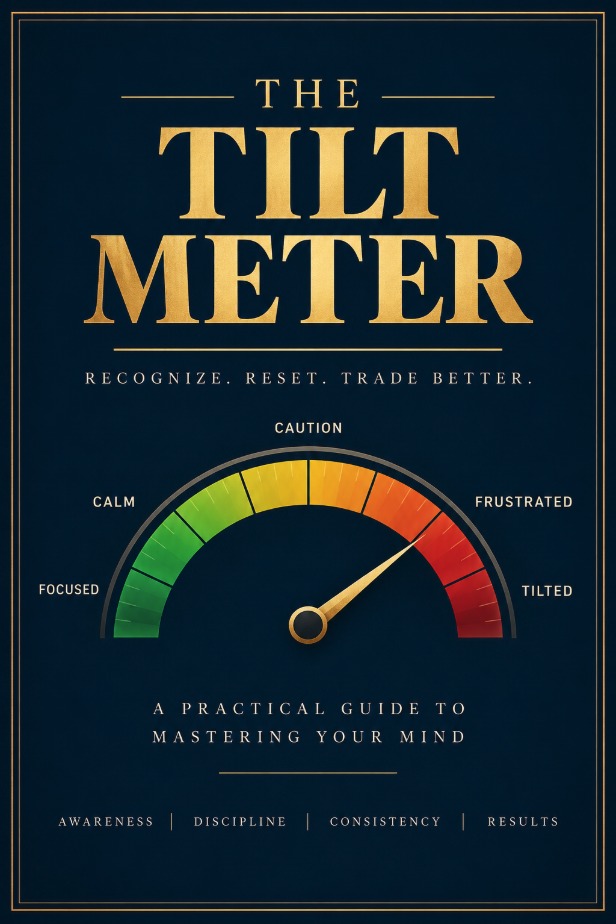
A scored way to catch tilt before it costs you: four session signals, a weighted score, and a live calculator plus a full session tracker that logs your trades automatically.
Try the live score calculator right on the sales page
Trading Tool · PDF + Live Calculator
Three numbers, set from your own account, that decide when your trading day is over: a daily max loss, a max number of losing trades, and a profit-protection stop.
Try the live calculator right on the sales page
Trading Tool · PDF + Live Calculator
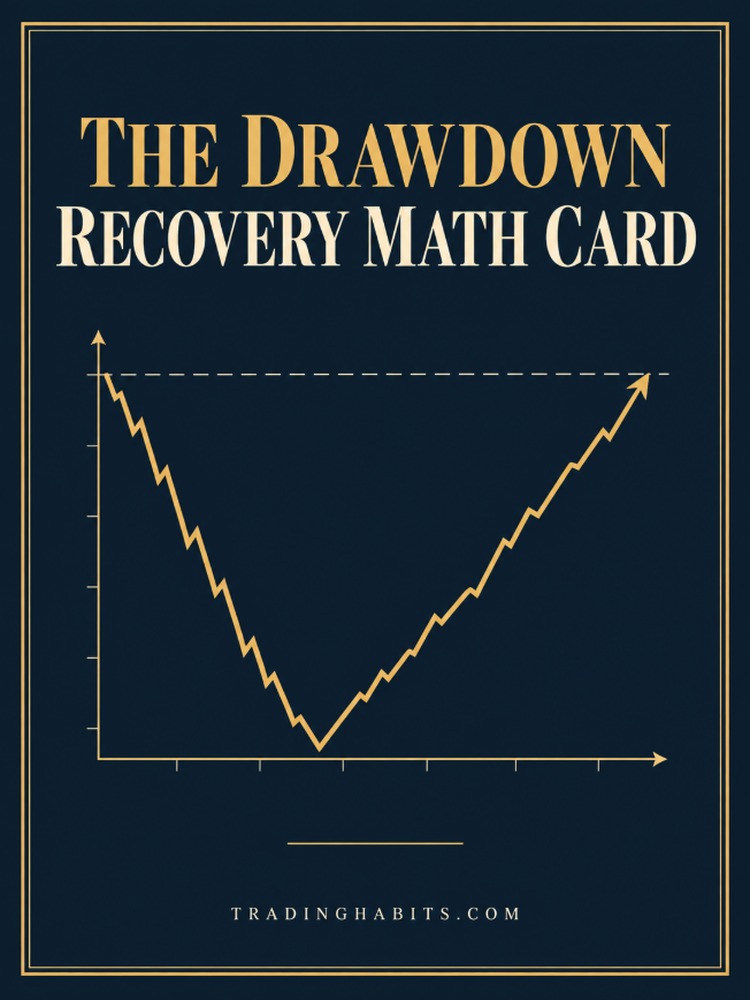
The one formula every drawdown obeys: why a 20% loss needs a 25% gain to recover, and a 50% loss needs a full 100% gain, with a full reference table and a live recovery tracker.
Try the live calculator right on the sales page
Trading Tool · PDF + Live Calculator
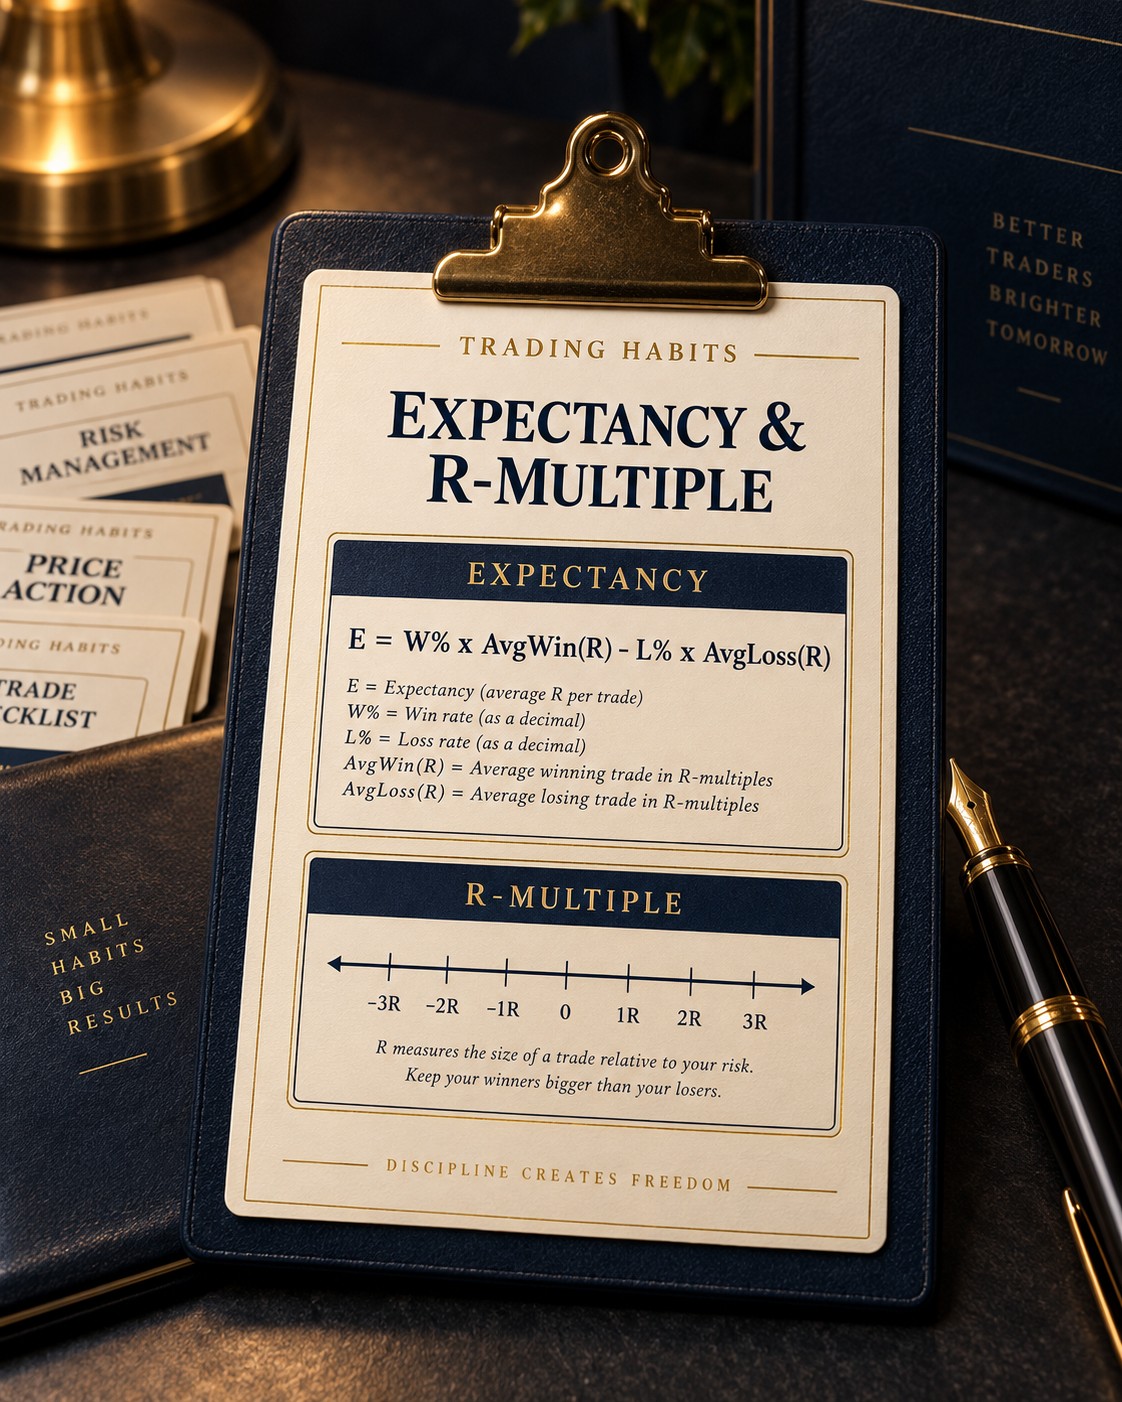
A 70% win rate can lose money and a 30% win rate can print. The formula that actually decides your edge, a full win-rate-by-reward-ratio grid, and the breakeven win rate every ratio has to clear.
Try the live expectancy calculator right on the sales page
Trading Tool · PDF + Live Calculator
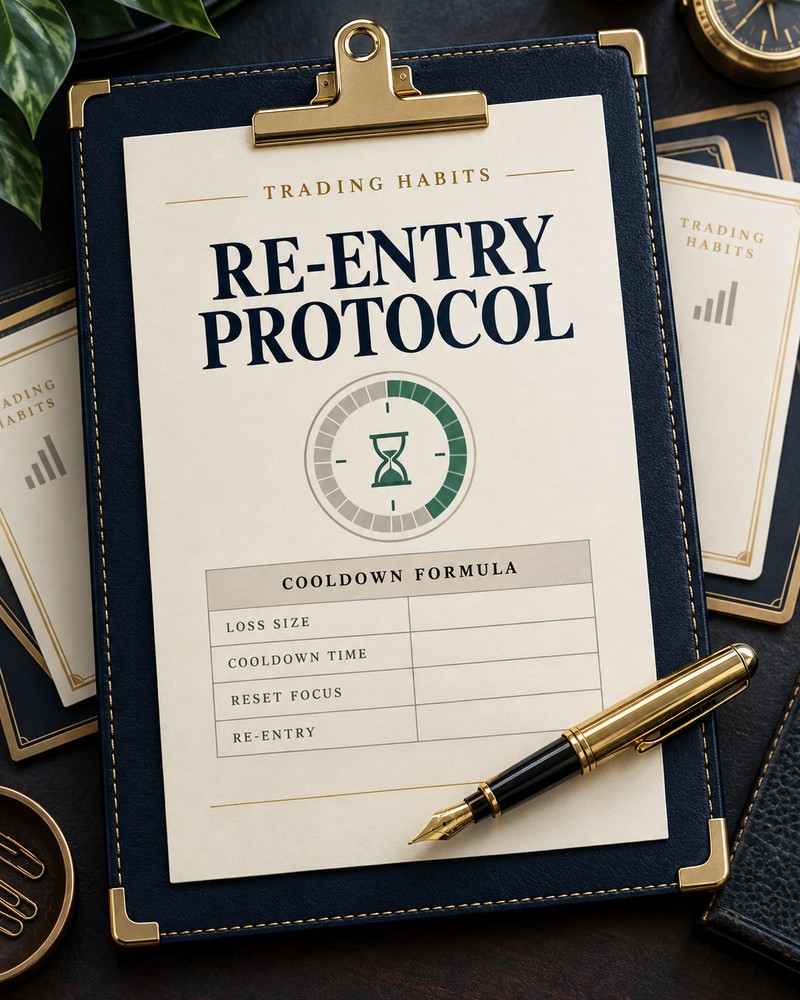
A cooldown formula, a three-question clearance checklist, and a size step-down ladder that decide when you're actually clear to take the next trade after a loss.
Try the live clearance calculator right on the sales page
Trading Tool · 10-Page PDF Workbook
A manual scorecard for scoring every setup you trade on win rate, R-multiple, rule-adherence, and tilt overlap, plus a process-vs-outcome tracker and a weekly rollup page.
Try the live edge-score calculator right on the sales page
Trading Tool · PDF + Live Calculator
A fixed six-state taxonomy and one formula that turns your own trade log into a dollar figure per feeling: (Calm-State Avg − A State's Avg) × Trades In That State.
Try the live two-state comparison calculator right on the sales page
Risk & Trading Psychology
Each product comes with a 60-day no-questions-asked guarantee. Select your product and place your secure order now.
None of the mistakes below are unique to trading. Loss aversion, the disposition effect, and escalation of commitment were all studied and named in psychology and economics journals, decades before any of these traders ever opened a chart. Each report page includes a short section on the research the report is built on, with the original study, the year, and where it was published.
Risk & Trading Psychology · 20 Pages
What moving your exit mid-trade really costs you, in plain numbers: the psychology behind widening a stop-loss, the research on why it happens, and what actually reduces it.
Drag your own loss through the same multipliers
Risk & Trading Psychology · 20 Pages
Why the very next trade after a loss gets sized bigger, aimed at winning it back fast: the research behind loss-chasing and the break-even effect, and what actually stops it.
Watch risk compound as you chase back to even
Risk & Trading Psychology · 20 Pages
Why sizing up after a winning streak is the moment discipline breaks down: the research behind the hot-hand fallacy and the house money effect, and what the math says it costs.
Watch size climb while the odds stay flat
Risk & Trading Psychology · 20 Pages
Why adding to a losing position without a cap is the trade that ends the account: the disposition-effect research, the break-even math, and a 20,000-path simulation of what it actually costs.
Try adding to the same losing position and watch the math
Risk & Trading Psychology · 20 Pages
Why traders keep going after they said they'd stop for the day: the prop-firm data on daily-loss-limit breaches, the tilt and ego-depletion research behind it, and a 20,000-day simulation of what it costs.
Watch size creep in after your own limit is hit
Risk & Trading Psychology · 20 Pages
What buying after the move already happened really costs: the FOMO and herding research behind chasing an entry, the exact risk-to-reward math it destroys, and a 20,000-account simulation of what it does over time.
Watch the risk-to-reward ratio collapse as you chase
Risk & Trading Psychology · 20 Pages
Why redepositing into a losing trading account almost never buys back the loss: the clinical loss-chasing research behind it, genuine prop-firm rebuy economics, and a 20,000-trader simulation of what it costs.
Stack your own reloads and watch the exposure grow
Risk & Trading Psychology · 20 Pages
Why a winning trade you never took profit on so often ends up back where it started: the reference-point and house-money research behind ignoring a hit target, an exact gambler's-ruin probability result, and a 20,000-trade simulation of what it costs.
Watch an open gain round-trip back to breakeven
Risk & Position Sizing · 20 Pages
Why several positions that each pass a normal per-trade risk check can still add up to one much larger bet: the portfolio-theory math behind correlated risk, a 1952 paper and three later studies, and a 20,000-trial simulation of what correlation actually costs.
Drag the correlation slider across three positions
Risk & Position Sizing · 20 Pages
Why a calculated stop-loss isn't a promise of a price once a scheduled high-impact release hits: the market-microstructure research behind the spread widening and volatility jump, two worked hypothetical accounts, and a 20,000-account simulation of what trading through the news actually costs.
Step through a news release tick by tick
Risk & Position Sizing · 20 Pages
What happens when the dollar amount risked per trade gets set once and never recalculated against the account's current balance: the Kelly/Vince research behind fixed-fractional sizing, two worked hypothetical accounts against a genuine drawdown floor, and a 20,000-account simulation comparing frozen sizing against sizing that rescales.
Drag your own account size and watch the percentage move
Trading Psychology · 20 Pages
What happens when a trade gets taken not because a setup showed up, but because nothing else did: the sensation-seeking and gamification research behind it, the market's own scheduled low-volume "dead zone," two worked hypothetical accounts, and a 20,000-account simulation of what one boredom trade a day actually costs.
Step through the session's dead-volume hours
Risk & Position Sizing · 20 Pages
What happens when a trade's exit exists only as an intention and never as an order the broker can act on: the loss-aversion and disposition-effect research behind why a mental stop fails, two worked composite accounts, and a 3,000-account Monte Carlo simulation comparing an enforced stop against a skipped one.
See what a loss actually takes to undo
Trading Psychology · 20 Pages
What happens when a plan-confirmed signal never gets taken, or gets taken at a fraction of size, purely because of a recent loss: the research behind why one bad outcome changes how the next signal gets judged, two worked composite accounts, and a 3,000-account Monte Carlo simulation comparing full compliance against selective compliance.
Flip the outcome and watch your own verdict change
Risk & Trading Psychology · 20 Pages
What happens when a position sized for an ordinary day gets carried straight through a scheduled earnings or macro release: the options-pricing math behind why that day is priced to move more, two worked composite accounts, and a 3,000-account Monte Carlo simulation comparing event-blind sizing against event-adjusted sizing.
Move the calendar and watch the priced-in range jump
Market Structure & Options · 20 Pages
What zero-days-to-expiration options actually do inside a single trading session: the exchange history behind their explosive growth, a 2023 study on who's really winning, a full mechanics case study, and a 5,000-path simulation of what a small daily 0DTE bet does to an account over a year.
Slide between 2016 and 2025 on the volume chart
Market Structure & Retail Trading · 20 Pages
How a short squeeze and a gamma squeeze actually work mechanically, the fully documented GameStop case from January 2021, published research on what chasing a move late tends to cost, and an original 20,000-path simulation showing how much entry timing alone changes the outcome.
Step through the six-week timeline on the page
Market Structure & Account Rules · 20 Pages
What the $25,000 pattern day trader rule actually required, why FINRA replaced it with a new intraday margin standard effective June 4, 2026, what didn't change, and an original 20,000-account simulation on trade frequency and risk.
Step through the rule's twenty-five-year run
Prop Trading & Account Evaluations · 20 Pages
What actually happens inside a prop firm evaluation, what an independent study of 300,000 genuine accounts found about who passes and who gets paid, the behavioral-finance research behind most failed evaluations, and an original simulation on how position sizing decides the outcome against a drawdown ceiling.
Step through the 2024 funded-account shakeout
Trading Technology & Automation · 20 Pages
What a retail trading bot actually is mechanically, a genuine research finding on where bot losses show up, what happened when eight frontier AI models actually traded genuine contests, and an original simulation showing how a strategy tuned to the past falls apart once it meets the present.
See what beating this win rate actually takes
Market Structure & Product Mechanics · 20 Pages
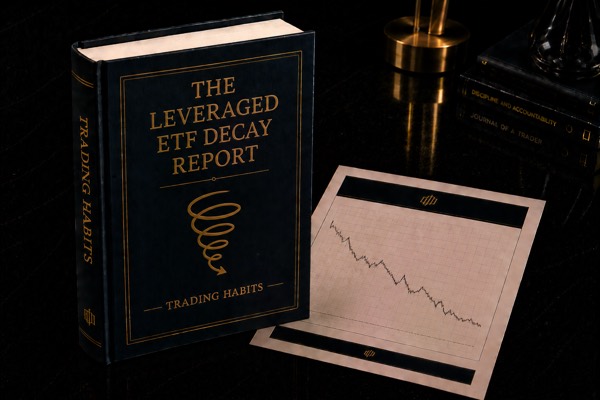
What a 2x or 3x single-stock ETF actually does to your money on a day the stock goes nowhere, the compounding math behind daily reset, a genuine 2018 case study of a nearly identical structure losing 96 percent in a session, and an original 20,000-path simulation across three market conditions.
Watch daily-reset compounding work against direction
Market Structure & Emerging Markets · 20 Pages
How event contracts actually work, the volume numbers behind the 2026 boom, the CFTC-versus-states regulatory fight, a historical study of the 2024 election markets, and an original simulation of what trading with the crowd actually costs.
See what the spread costs over many contracts
Trading Technology & Retail Platforms · 20 Pages
How copy trading actually works mechanically, the growth numbers behind the boom, the research on risk-taking and popularity, the leader-follower split the industry's own data keeps finding, and an original 20,000-pair simulation of what following someone else actually costs.
See what copying actually costs a leader's return
Market Structure & Regulation · 20 Pages
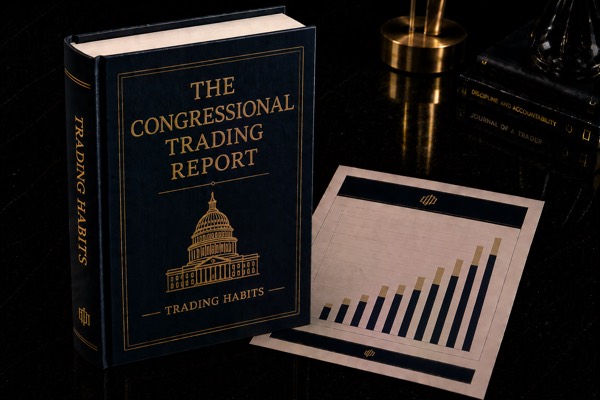
What the STOCK Act actually requires, the 2004 study that started the legend and the 2013 study that fought back, a 2020 study covering the years since the law changed, the documented filing-lag data behind every disclosure, and an original simulation of what that delay costs a reader trying to follow along.
See what a filing delay does to a signal's value
Market Structure & Order Routing · 20 Pages
Why 4 in 10 shares now trade off-exchange, where a retail market order actually goes before it fills, what payment for order flow really pays for, four genuine SEC enforcement cases, and an original simulation of what off-exchange routing is worth, and where it stops being a deal.
Try the midpoint-execution calculator on your own order
Market Structure & Trading Hours · 20 Pages
What already trades all night, the single venue behind most of it, the 2026 exchange-level regulatory sprint toward 24-hour markets, FINRA's own six disclosed risks, the April 2025 stress test, and an original simulation of what thin overnight liquidity actually costs and risks against a regular session.
See what overnight execution costs on your own order size
Market Structure & Options Mechanics · 20 Pages
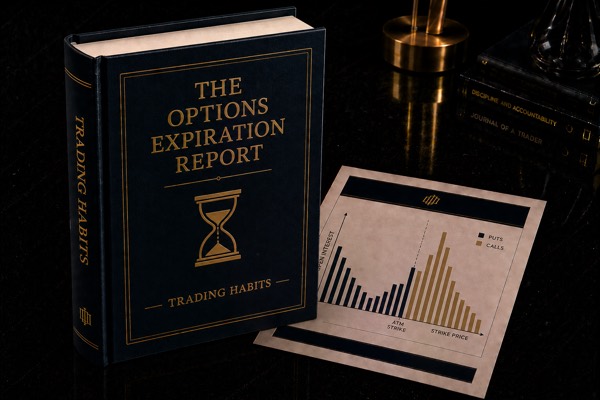
What max pain theory actually predicts, the 2005 academic study that tested it against genuine clustering data, the mechanics of dealer gamma, the December 2025 $7.1 trillion record witching day, and an original simulation isolating how much of a strike-price "pin" is ordinary chance.
Try the illustrative move-size odds calculator
Market Structure & Calendar Patterns · 20 Pages
What the Halloween Indicator, the January Effect, and the Santa Claus Rally are actually built on, what published research across 37 markets found, and two original simulations testing how much of the pattern is noise and what chasing it costs after fees.
Try the switching-strategy cost calculator
Market Structure & Technical Signals · 20 Pages
What the 1992 study that started the debate actually found, what a true out-of-sample test found on 25 years of fresh data decades later, a separate 2000 study on whether chart patterns carry information, and two original simulations pricing out what trading every golden and death cross costs.
Try the whipsaw-cost calculator
Market Structure & Chart Patterns · 20 Pages
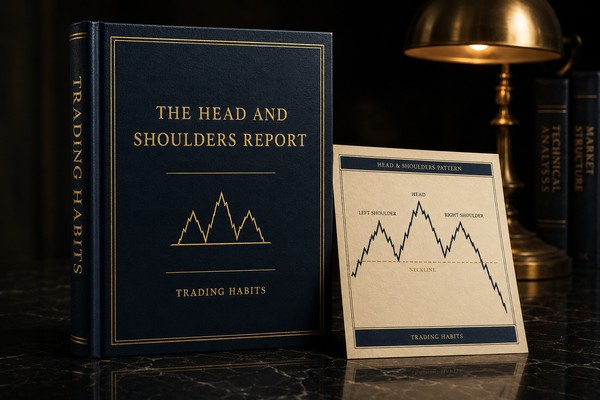
What the classic top and inverse pattern actually is, what a 2000 kernel-regression detection study found, what a widely cited win-rate catalog reports for both versions, and two original simulations testing how often the shape appears in pure noise and what trading every one detected actually costs.
Try the pattern expectancy calculator
Market Structure & Chart Patterns · 23 Pages
What the double top, double bottom, all three triangle types, and the bull flag and pennant actually are, what Bulkowski's published catalog says about each one, and two original simulations testing how often these shapes appear in noise and what mechanically trading every confirmed setup costs.
Try the per-setup expectancy calculator
Market Structure & Sector Rotation · 20 Pages
The hyperscaler capex cycle behind the 2026 AI infrastructure buildout, the documented power-grid constraint driving it, the GPU supply chain's actual bottleneck, a historical buildout parallel, and an original simulation pricing out what reacting to every headline inside the theme costs against holding.
Try the headline-chasing cost calculator
Risk & Trading Psychology · 20 Pages
Why trading with money you cannot afford to lose changes how the exact same setup gets managed, backed by 5 cited studies, two worked case studies, and a 10,000-account simulation.
Watch modeled hold time climb as the money gets more essential
Risk & Trading Psychology · 20 Pages
Why the "one more check" you run the instant a stop is touched almost always finds a reason to stay in: the research behind confirmation bias in a live trade, two worked case studies, and a 3,000-account simulation.
Watch the final loss grow as the found evidence feels more convincing
Risk & Trading Psychology · 20 Pages
Why your worst trades of the day show up late in the session, not after a loss: the decision-fatigue research behind it, two worked case studies, and a 3,000-account simulation.
Watch win rate erode as the session gets longer
Risk & Trading Psychology · 20 Pages
Why a winning trade closed well short of its own plan's target costs more than a loss ever shows: the disposition-effect research behind it, two worked case studies, and a 3,000-account simulation.
See where a winning trade actually gets closed on a short leash