The Exact Same Trade, On The Exact Same Chart, Can End In A Loss Twice As Large Depending On One Thing That Has Nothing To Do With The Setup. Here's The Research Behind It.
There's a single fact about the money sitting in your trading account that changes how every trade on that account actually gets managed, and it has nothing to do with your strategy, your stop, or your setup.
It's not how much money it is. It's what the money is for.
Traders call it scared money.
You'll see a 1979 study connected to a Nobel Prize in Economics that measured the exact ratio between how bad a loss feels and how good an equal gain feels, and why that ratio gets worse the moment a dollar has rent attached to it.
You'll walk through two case studies built on the identical $3,000 account, the identical setup, and the identical price path, where the only variable that changes is what the money was for, and the final loss comes out $160 apart.
You'll see a 10,000-account simulation where two groups start with the exact same 45% edge, and one group's blowup rate, a 50%-plus drawdown, ends up roughly 10 times higher than the other's.
You'll get the 4-part test that tells you, before the next trade, whether the money sitting in your account is safe to risk or already spoken for.

You'll walk through two case studies built on the identical account, the identical setup, and the identical price path, where the only variable that changes is what the money was for, and the final loss comes out $160 apart.Jason Parker, Founder of Trading Habits
Introducing The Scared Money Trade: the 20-page report laying out all of it, with the exact page number attached to every claim above.
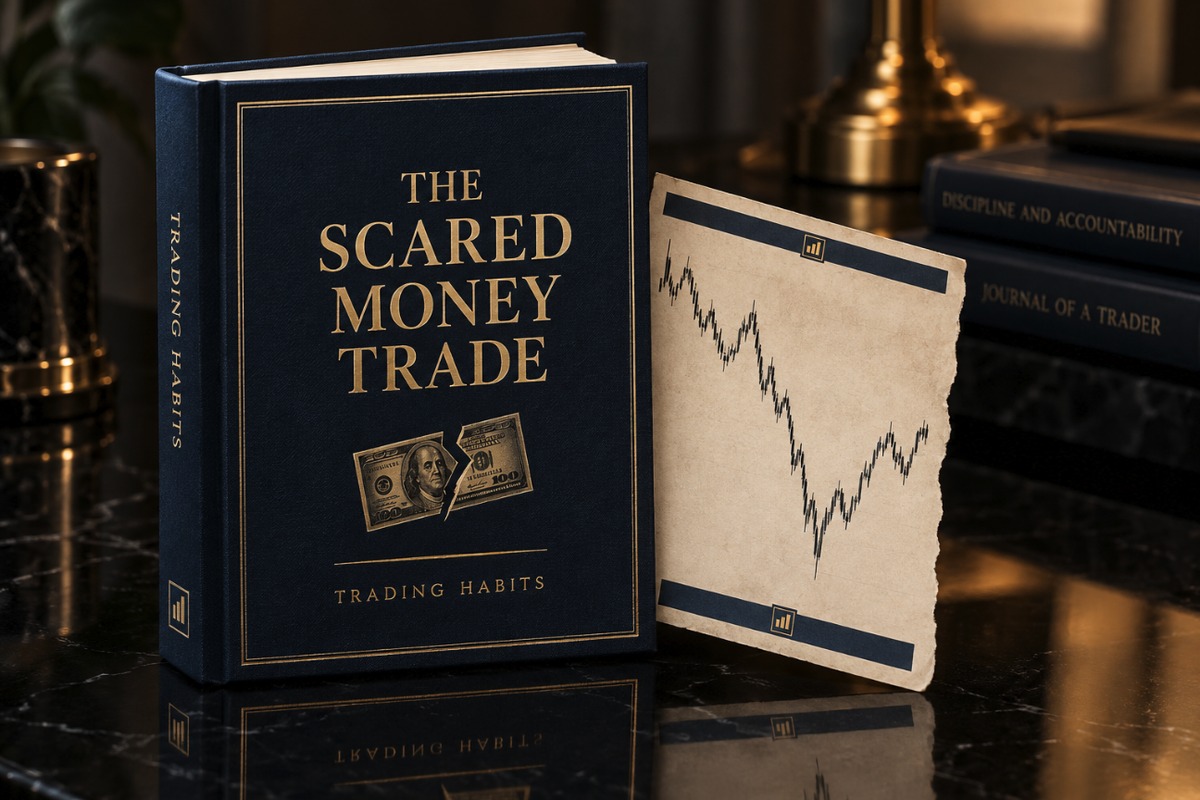
A Trading Habits Report
The Scared Money Trade
What happens when the money on the table isn't yours to lose, worked out in full.
- Length 20 pages, with 5 original charts and two worked case studies
- Author TradingHabits.com
- Format PDF, delivered as an instant download right after checkout
- Covers The research and psychology behind trading with essential money, the exact math a scared-money trade runs backward, a 10,000-account simulation, and a 4-part test for telling the two kinds of dollars apart
This report breaks down the research, the math, and the numbers on one specific decision.
What's Inside
20 Things This Report Actually Says
- 01Every trading account holds two kinds of dollars that look completely identical on the statement, and only one of them actually decides how the next trade gets managed.Page 3
- 02A 1979 study that helped win a Nobel Prize in Economics found a $100 loss and a $100 gain are never actually equal, by a specific, repeatable ratio.Page 4
- 03The exact reason a $150 loss on one account and a $150 loss on another account are not, psychologically, the same $150 loss at all.Page 4
- 04Why a trader who won't take a small loss will often take a much bigger one minutes later, driven by the exact same mechanism both times.Page 5
- 05The bent curve two researchers drew straight from experimental data, and why it explains why the first dollar of a loss hurts worse than the twentieth.Page 5
- 06A 1990 study on gamblers found people get looser with money they just won. The mirror-image effect, on money that was never a gain to begin with.Page 6
- 07On the identical $500 adverse move, one kind of trade got closed out in 3 minutes. The other kind got held for how long.Page 6
- 08A 1985 finance study named this exact pattern. What happens to it once the money attached to the trade is rent instead of risk capital.Page 7
- 09The same trader, the same day: a $40 winner taken off a $120 target instantly, and a $300 loser held past a $150 stop without blinking. What connects both decisions.Page 7
- 10Researchers wired professional traders with the same category of sensor used in a polygraph. What actually lit up had nothing to do with whether the trade was winning.Page 8
- 11A 2013 study measured farmers' raw brainpower before and after harvest. The same measurable tax, applied to a trading account, for the first time in this report.Page 9
- 12Four separate exit-behavior numbers, modeled side by side for the identical setup traded two different ways, and the gap on the losing side is more than double.Page 10
- 13A $3,000 account, a $150 planned stop, and a Friday rent payment. Walked through dollar by dollar to a final loss more than double the plan.Page 11
- 14The exact same chart, the exact same entry, and a second trader who walks away with a loss $160 smaller. What the only difference between the two accounts was.Page 12
- 15The position-sizing formula that gets run backward when the money on a trade is owed to somebody else, and the exact share-count multiple it produces.Page 13
- 1610,000 simulated accounts trading the identical 45% edge. One group's median equity curve rises. The other's doesn't, and nothing about the edge was different.Page 14
- 17The exact percentage of simulated accounts that crossed a 50% drawdown line, and how many times higher that number was for one group than the other.Page 15
- 185 separate studies, published decades apart, none of them written about trading. What they all point at once applied to a live account.Page 16
- 196 observable signs that a trade is about to be funded by the wrong kind of money, each one checkable before the entry ever goes in.Page 17
- 20The 4-part test that decides, dollar for dollar, whether money sitting in a trading account is safe to risk or already spoken for.Page 18
HABITS
★
Certificate of Guarantee
60-Day, No-Questions-Asked
If The Scared Money Trade doesn't earn its place on your desk, email us any time within 60 days of purchase for a full refund. No form to fill out. No reason required.
Instant Download
$7One-time payment. No subscription.
Order Now20-PAGE PDF · DELIVERED IMMEDIATELY AFTER CHECKOUT · 60-DAY GUARANTEE
Behind The Report
Loss Aversion And The Reflection Effect
The loss side of the curve is steeper than the gain side, which is why a $150 loss never quite balances out a $150 gain.
The Concept
Loss aversion is the finding that a loss and an equivalent gain are not weighted the same way psychologically. Losing $100 hurts measurably more than gaining $100 feels good, by a ratio that consistently lands near two to one across decades of replication.
The reflection effect is the closely related finding that people are risk-averse when a choice looks like a likely gain, and risk-seeking when the same choice looks like a likely loss, which is why a small loss gets frozen on and a larger one gets gambled on.
Where It Comes From
Daniel Kahneman and Amos Tversky published Prospect Theory in a 1979 issue of Econometrica, work that later contributed to a Nobel Prize in Economics. It remains one of the most cited papers in behavioral economics.
Richard Thaler and Eric Johnson extended the picture in a 1990 Management Science paper documenting the house money effect, the tendency to take more risk with money that was just won. Scared money runs the asymmetry in the other direction: money that was never a gain, and was assigned to a purpose before the trade was ever placed.
What Happens To The Same $500 Loss, Depending On What The Money Was For
Illustrative modeled comparison: the identical $500 adverse move on the identical setup, held for roughly 9 times longer past the planned stop once the money on the line was rent instead of risk capital.
Try It: Watch Hold Time Past The Stop Climb As The Money Gets More Essential
Modeled from the report's Figure 2 data: 3 minutes held past the stop when the money is risk capital, 28 minutes when the identical move is funded by essential money. Drag the slider to see the modeled hold time in between.
Background only. The report itself works the exact position-sizing math a scared-money trade runs backward, and runs it across a 10,000-account simulation.
Common Questions
Is loss aversion an actual measured effect or just a trading-floor saying?
Measured. Daniel Kahneman and Amos Tversky documented it directly in their 1979 Econometrica paper on Prospect Theory, work that later contributed to a Nobel Prize in Economics, and it has been replicated across decades of follow-up research.
Does the reflection effect explain both cutting winners short and holding losers too long?
Yes. Being risk-averse for likely gains explains taking a small win off the table early, and being risk-seeking for likely losses explains holding a loser well past a planned stop. Hersh Shefrin and Meir Statman documented the resulting pattern directly in a 1985 Journal of Finance paper on the disposition effect.
Is the house money effect the same thing as scared money, just the opposite?
Closely related. Richard Thaler and Eric Johnson's 1990 Management Science research found people take more risk with money they just won, treating it as the house's money. Scared money runs that same asymmetry in reverse, on money that was never a gain and was already earmarked for something else.
Sources & Further Reading
-
Kahneman, D. & Tversky, A. (1979). “Prospect Theory: An Analysis of Decision under Risk.” Econometrica, 47(2), 263-291.
The loss aversion and reflection effect this report's value-function chart is built from.
-
Thaler, R. H. & Johnson, E. J. (1990). “Gambling with the House Money and Trying to Break Even.” Management Science, 36(6), 643-660.
The house money effect, and its mirror image in how scared money gets handled after a loss.
-
Shefrin, H. & Statman, M. (1985). “The Disposition to Sell Winners Too Early and Ride Losers Too Long.” The Journal of Finance, 40(3), 777-790.
The disposition effect this report finds amplified once a trade is funded by essential money.