You Don't Feel Tilt Coming. You Feel Fine, Right Up Until The Fourth Loss
Asking yourself "am I tilting right now" is the least reliable question you can ask, at the exact moment it matters most to get the answer right.
You'll get a score built from four things that are already true about your session, consecutive losses, whether your size just went up, how many trades left your plan, and how long ago your last loss was, so the question stops being a feeling you have to self-diagnose.
You'll get the exact point value for each signal and the exact action tied to each zone, Clear, Caution, Warning, or Stand Down, worked through one full losing session so you can see exactly how the score builds, trade by trade, not vague advice.
You'll get the same score running live in your browser twice: a one-screen version on this page, and a fuller version on your download page that logs every trade and keeps score for you automatically.
This card won't stop you from taking a loss.
It isn't trying to.
What it does is give the moment right after a loss, the moment the break-even effect starts pulling at your next decision, a fixed rule that fires the same way every time, so the call to stop doesn't have to be made by whatever mood you're in when you most need to make it correctly.

Asking yourself "am I tilting right now" is the least reliable question you can ask, at the exact moment it matters most to get the answer right.Jason Parker, Founder of Trading Habits
Introducing The Tilt Meter.
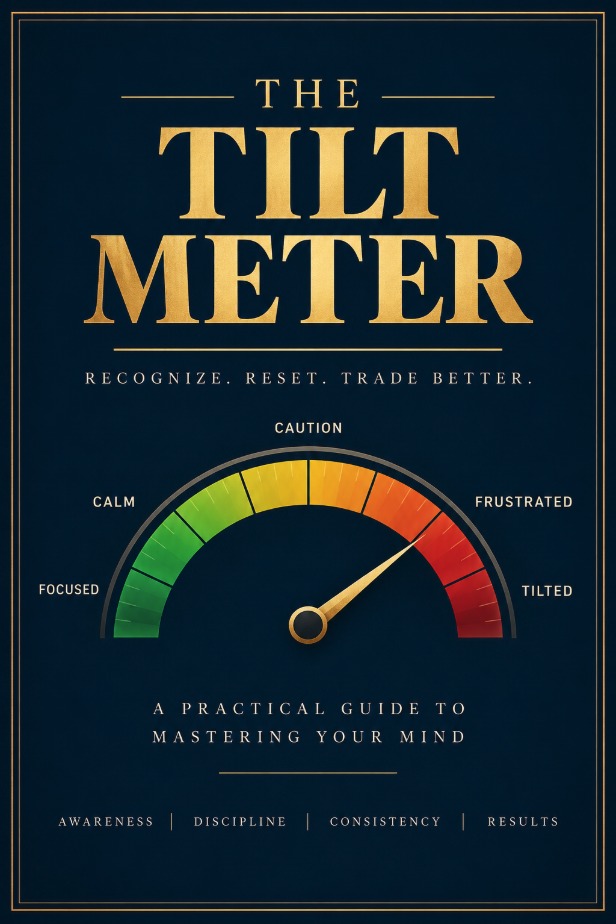
The Tilt Meter
A scored, rule-based way to catch tilt before it costs you, built from your own session facts.
- Format PDF, 7 pages, print or read on screen
- Covers The four-signal score, zone actions, a worked session, and your own baseline worksheet
- Includes A live calculator on this page and a fuller session-logging tool on your download page
- Delivery Instant download right after checkout
A self-report rule of thumb, not a clinical or psychological diagnostic tool.
What's Inside
What's Inside The Tilt Meter
- 01The break-even effect, from Thaler & Johnson's 1990 Management Science study, explained plainly: why a recent loss pushes people toward more risk trying to get back to even, not less.
- 02What Coates & Herbert's 2008 cortisol study on a London trading floor actually found, and didn't: stress tracked volatility and uncertainty, not simply losing, with the authors' own caution about how far that result can be stretched.
- 03Lo & Repin's physiological research showing even highly experienced traders react during genuine volatility events, tilt isn't a beginner problem that experience erases on its own.
- 04The four signals the score watches: consecutive losses, size on your last trade, trades outside your plan today, and minutes since your last loss.
- 05The full point table for every signal, plus the four zones, Clear, Caution, Warning, Stand Down, each with one specific action, not a vague suggestion to "stay calm."
- 06One fully worked example: four trades, four running scores, showing exactly how a session climbs from Clear to Stand Down as the signals stack.
- 07A one-time baseline worksheet for defining your own "normal size" and listing today's planned setups, so the score has something specific to compare against.
- 08A blank daily scoring log for running the math by hand, plus two live versions of the same tool online, one on this page, a fuller one on your download page.
HABITS
★
Certificate of Guarantee
60-Day, No-Questions-Asked
If The Tilt Meter doesn't earn a spot in your files, email us any time within 60 days of purchase for a full refund. No form to fill out. No reason required.
Instant Download
$7One-time payment. No subscription.
Order Now7-PAGE PDF · DELIVERED IMMEDIATELY AFTER CHECKOUT · 60-DAY GUARANTEE
Behind The Tool
Where The Pull To "Get It Back" Actually Comes From
The Concept
Richard Thaler and Eric Johnson's 1990 study "Gambling With The House Money And Trying To Break Even," published in Management Science, found that a recent loss changes what people are willing to risk next. People given a chance to recover a prior loss took on more risk trying to get back to even than they otherwise would, a pattern the paper named the break-even effect. The same study found the mirror pattern too: a recent gain made people more willing to risk it, the house-money effect.
Neither effect is a character flaw. It's a documented, repeatable pattern in how people weigh risk right after an outcome, which is exactly why a fixed rule, checked the same way every time, is more reliable than deciding in the moment whether this particular loss "feels different."
Where It Comes From
John Coates and Joe Herbert's 2008 study in the Proceedings of the National Academy of Sciences measured cortisol in working traders on a London trading floor across eight trading days. Cortisol rose with the volatility of the market and the trader's own results, not simply with taking a loss. The authors were careful to frame the idea that sustained elevated cortisol could shift risk preferences over longer stretches as a hypothesis for future research, since their own study window was short.
Separately, Andrew Lo and Dmitry Repin's psychophysiology research measured skin conductance and blood volume pulse in traders during live market moves and found measurable physiological reactions even in highly experienced traders, muted for routine noise, still present during genuine volatility events.
Try It: Score A Single Snapshot Of Your Session
Weights: consecutive losses up to 40 points, size up to 25, trades outside your plan up to 25, recency up to 10. Zones: 0–24 Clear, 25–49 Caution, 50–74 Warning, 75–100 Stand Down. The full session tracker on your download page fills these four fields in for you automatically as you log each trade.
Background only. The card itself works the full score end to end and gives you a blank worksheet and a baseline sheet for your own trades.
Common Questions
Is this a clinical or medical tool for diagnosing tilt?
No. It's a self-report rule of thumb built entirely from facts about your own session, how many losses in a row, your size, your plan, and time elapsed. It isn't a psychological or medical instrument and doesn't claim to be one.
Does one loss on a normal-size, in-plan trade trigger a warning?
No. A single ordinary loss scores well inside the Clear zone. The score is built to escalate only as multiple signals stack, consecutive losses, rising size, and trades outside your plan together, not to flag every routine loss any strategy under a 100% win rate is going to have.
What did the Coates & Herbert cortisol study actually prove?
It found that traders' cortisol tracked how volatile the market and their own results were, over an eight-day window, and correlated with morning testosterone and that day's profitability. The authors explicitly flagged the idea that sustained stress could shift risk preferences over longer periods as a hypothesis for future work, not a result their short study proved.